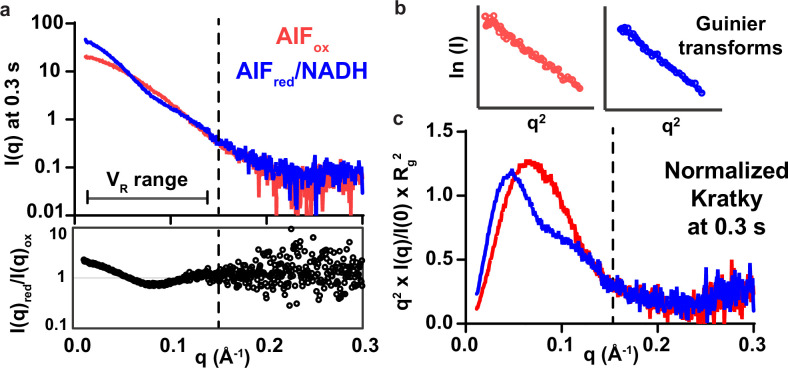
Extended Data Fig. 2. HT-SAXS DMSO benchmarks.
(a) SAXS scattering curves (300-ms exposure) and analysis of oxidized AIF monomer (red) and NADH−reduced AIF dimer (blue). The ratio of the scattering intensities (lower panel) highlights the uniqueness of the SAXS profiles for the two allosteric states. The q-range (0.015 – 0.15 Å-1) used for VR similarity analysis is indicated by the dotted line. (b) Linear Guinier transforms of the SAXS curves indicates an absence of aggregation. See also Supplementary Table 3. (c) Plots of normalized Kratky transforms.

