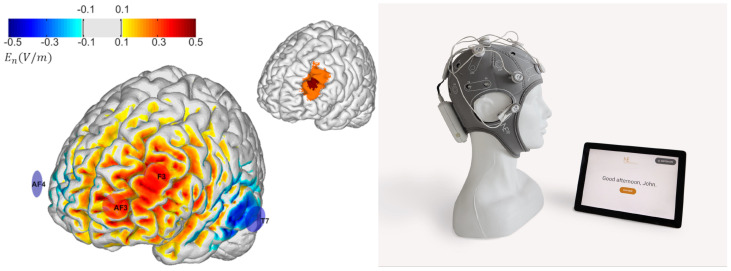
Figure 3.
Left: Montage design produced by group optimization. The selected group optimized montage consisted of 4 electrodes: two anodes located over the target (AF3 and F3) and cathodes located further away (T7 and AF4). The color scale represents En, the normal component (normal to the cortical surface with red/blue denoting inward/outward E-field normal component) of the E-field induced by the optimized montage in the cortical surface (in V/m). Right: Starstim Home system (including tablet).

