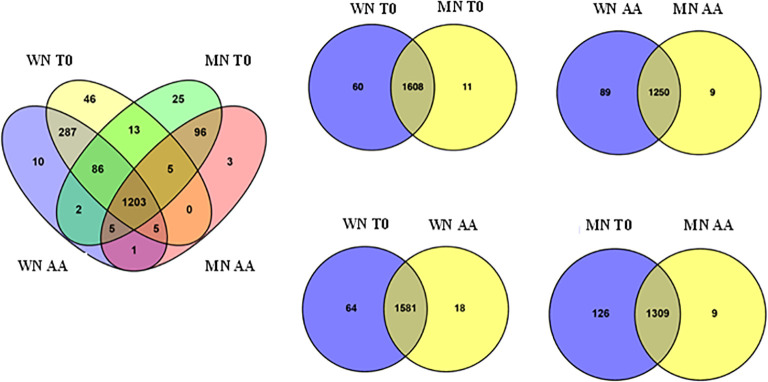
Figure 2.
Venn diagrams illustrating the number of identified proteins that are unique and common to the chia genotypes (WN, MN) and aging treatments (AA or T0) analyzed. The left Venn diagram shows all unique and common proteins among genotypes and treatments. Right Venn diagrams show unique and common proteins when comparing by pairs the genotypes (WN or MN) and/or treatments (AA or T0).

