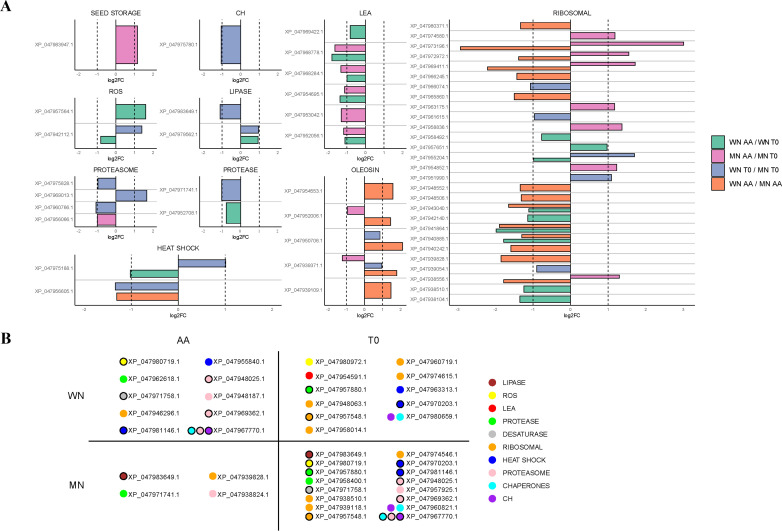
Figure 5.
Comparisons of differentially expressed proteins (DEP) among chia genotypes with (AA) or without (T0) aging treatment. (A) Various Log2FoldChange (log2FC) comparisons are visually depicted using distinct colors. Differences between genotypes (WN and MN) under the same treatment conditions are indicated in blue for T0 conditions and orange for AA conditions. Additionally, variations between treatment conditions (AA, T0) for each chia genotype are represented in pink for the MN genotype and in green for the WN genotype. The proteins are categorized based on their biological function. (B) Exclusive DEP appearing per genotype and treatment. Proteins unique to each chia genotype and treatment. Proteins are color-coded based on their biological function. Specifically, proteins with lipase activity are represented in brown, those related to reactive oxygen species (ROS) in yellow, late embryogenesis abundant proteins (LEA-) in red, protease-related proteins in green, desaturase-related proteins in grey, ribosomal-related proteins in orange, heat shock-related proteins in dark blue, proteasome-related proteins in pink, chaperones in light blue, and carbohydrates-related proteins in purple. Black-bordered circles denote proteins that appear in more than one group, indicating their shared presence between chia genotypes or treatments. Only statistically significant differences, determined using a background-based t-test -with p.adj< 0.05, are shown.

