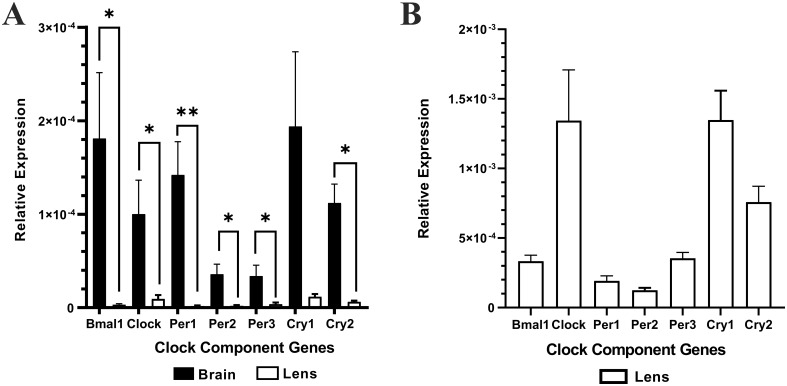
Figure 1.
The relative expression of the clock component genes in the brain and lens. Brain and lens tissue were harvested at 10am and RNA extracted for cDNA synthesis. RT-qPCR in combination with isoform specific primers for the clock component genes was then performed. (A) The relative expression of clock component genes in the brain compared to the lens. (B). Rescaled version of (A) to show the relative expression of clock component genes in the lens only. The relative expression for each clock component gene was calculated using the DCt method where the mean Ct value of the target gene is normalised to the b-actin internal control. Data is presented as mean relative expression ± the standard error of the mean (± SEM) from n = 4 rats. *p<0.05; **p<0.01.

