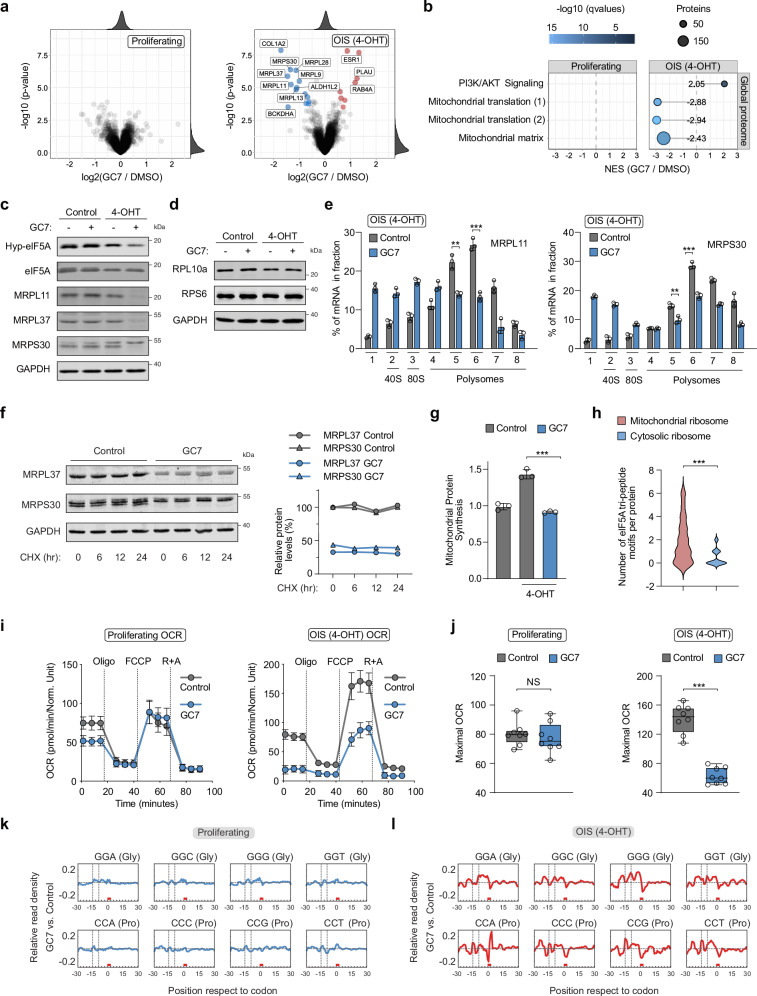
Fig. 5. eIF5A regulates the translation of mitochondrial ribosomal proteins in OIS cells.
a Differential protein expression after GC7 addition (12 hr) in proliferating (left) and OIS-BJ cells (right). Proteins with log2 fold difference > 0.5 and adj. p-value < 0.001 are in red; log2 fold difference <− 0.5 and adj. p-value < 0.001 are in blue. Empirical Bayes moderated t test and two-sided p-values. b Gene set enrichment analysis from (a). A negative NES indicates decreased expression upon GC7 treatment. Enriched gene sets (q-value < 0.05) from the Molecular Signatures Database are shown, including set size and q-value. PI3K/AKT Signaling (R-HAS-2219528); Mitochondrial translation (1) (R-HAS-5368287); Mitochondrial translation (2) (GO:0032543); Mitochondrial matrix (GO:0005759). c, d Western blots on cell extracts from proliferating and OIS BJ-Ras-ER cells treated with GC7 (10 μM) for 24 h. e Polysome analysis in OIS BJ-Ras-ER cells treated with GC7 (10 μM) for 24 h. Mean ± SD from n = 3 biologically independent experiments. Two-tailed unpaired t test: **P < 0.01; ***P < 0.001. f Cycloheximide (CHX) chase assay in OIS BJ-Ras-ER cells treated with GC7 (10 μM) for 24 h, with quantification. Data from two independent experiments. g Mitochondrial OP-Puro incorporation in proliferating and OIS BJ-Ras-ER cells treated with GC7 (10 μM) for 24 h. Mean ± SD from n = 3 biologically independent experiments. Two-tailed unpaired t test: ***P < 0.001. h eIF5A tri-peptide motifs per protein in human mitochondrial ribosomal proteins (n = 79) and all human ribosomal proteins (n = 76). Data represent motif distribution frequency. Chi-square test: ***P < 0.001. i, j Oxygen Consumption Rate (OCR) in proliferating and OIS BJ-Ras-ER cells treated with GC7 (10 μM) for 16 hours. (i) Mean ± SD from n = 8 biologically independent experiments. j Box plots (n = 8). The center line represents the median, upper and lower bounds represent the 75th and the 25th percentile, respectively. Whiskers represent minimum and maximum values. Oligomycin (Oligo, 0.5 μM), FCCP (1 μM), or Rotenone and Antimycin A (R + A, 0.5 μM each Two-tailed unpaired t test: NS is not significant; ***P < 0.001. k, l Cytosolic RPF density analysis in proliferating or OIS BJ-Ras-ER cells treated with GC7 (10 μM) for 18 hours. Codon regions of 61 nucleotides along the transcriptome are shown. Normalized 5′ ends of RPFs counted for each codon-region. Source data, including exact p-values, are provided as a Source Data file.

