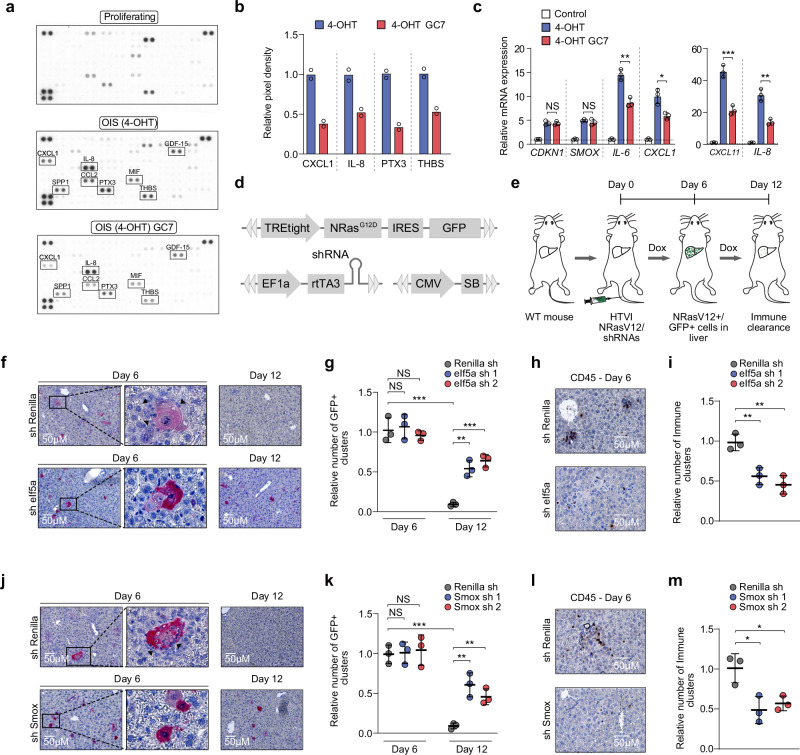
Fig. 6. Inhibition of eIF5A hypusination affects SASP expression, impairing immune surveillance of oncogene-induced senescent cells in vivo.
a Cytokine array of conditioned media from proliferating or OIS BJ-Ras-ER cells. OIS cells were treated with GC7 (10 μM) for 24 h. b Relative quantification of cytokines from (a). Data represent the mean of two independent experiments. c Expression of SASP genes in proliferating and OIS BJ-Ras-ER cells treated with GC7 (10 μM) for 48 h. Data represent mean ± SD from biologically independent experiments (n = 3). Two-tailed unpaired t test: NS, not significant; *P < 0.05; **P < 0.01; ***P < 0.001. d Scheme of Sleeping Beauty vectors used in experiments described in (e). e Experimental design to assess effects of repressing eIf5a and Smox on senescent cell clearance in the liver (HTVI, Hydrodynamic tail vein injection). f Representative immunohistochemistry (IHC) images of liver sections stained for GFP. Livers were collected at days 6 and 12 post-injection with vectors (d). Arrows indicate immune infiltrates. g Quantification of GFP-expressing cells in livers of animals injected with vectors. Livers were collected on days 6 and 12 post-injection. Data represent mean ± SD from biologically independent experiments (n = 3). Two-tailed unpaired t test: NS, not significant; **P < 0.01; ***P < 0.001. h Representative IHC images of liver sections stained for CD45, harvested on day 6 post-injection with vectors. i Quantification of infiltrated CD45-positive cells at day 6 post-injection. Data represent mean ± SD from biologically independent experiments (n = 3). Two-tailed unpaired t test: **P < 0.01. j Representative IHC images of liver sections stained for GFP collected on days 6 and 12 post-injection with shRNAs targeting Renilla or Smox mRNA. Arrows indicate immune cells near senescent cell clusters. k Quantification of GFP-expressing cells in livers injected with Renilla or Smox shRNAs. Livers were collected on days 6 and 12 post-injection. Data represent mean ± SD from biologically independent experiments (n = 3). Two-tailed unpaired t test: NS is not significant; **P < 0.01; ***P < 0.001. l IHC images of liver sections stained for CD45, harvested on day 6 post-injection with Renilla or Smox shRNAs. m Quantification of infiltrated CD45-positive cells at day 6 post-injection. Data represent mean ± SD from biologically independent experiments (n = 3). Two-tailed unpaired t test: *P < 0.05. Source data, including exact p-values, are provided as a Source Data file.

