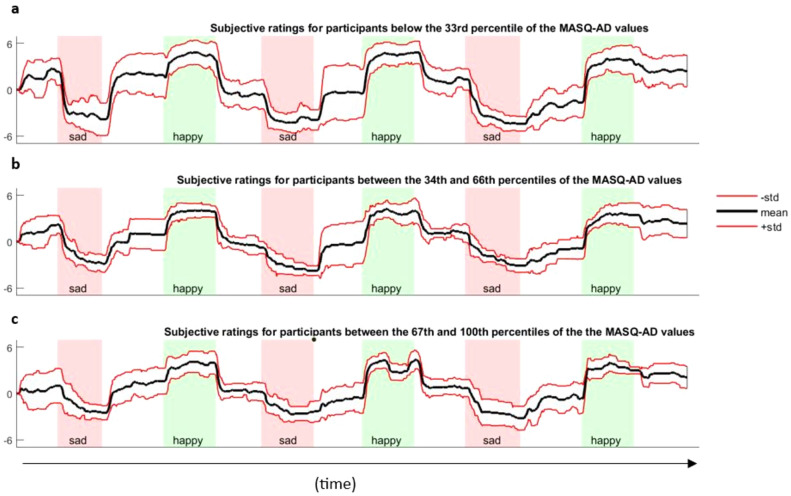
Figure 3.
Continuous subjective ratings throughout the entire music task, averaged across the participants with an MASQ-AD score (a) in the bottom 33% of the MASQ-AD values; (b) between the 34th and the 66th percentiles of the MASD-AD values; and (c) in the top 33% of the MASQ-AD values. The bold lines refer to the averaged subjective ratings. The red lines represent the standard deviation associated with the mean subjective ratings.

