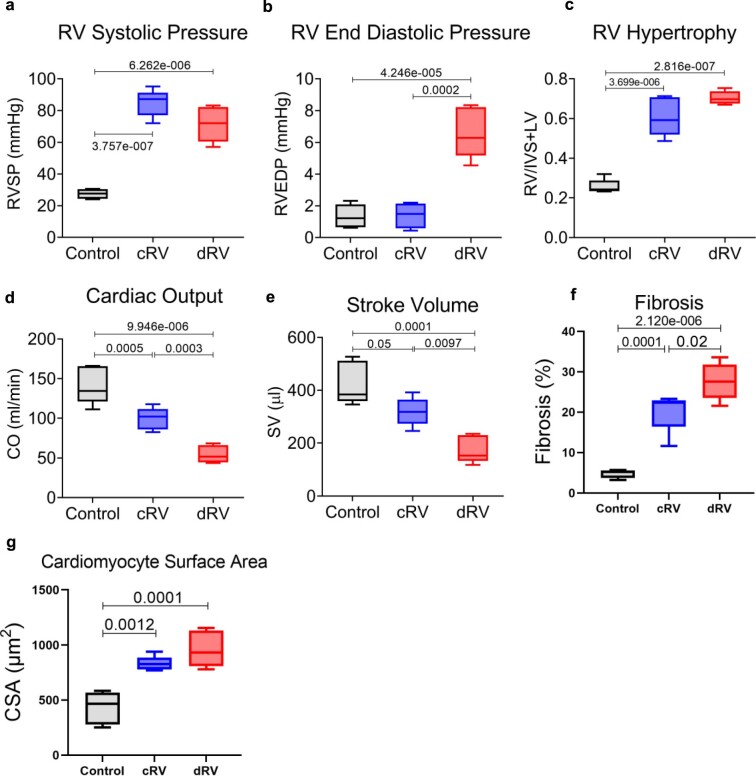
Extended Data Fig. 2. Hemodynamic assessment and RV function in rat PAB model.
(a) RV systolic pressure (RVSP), (b) RV end-diastolic pressure (RVEDP), (c) RV hypertrophy (RVH, calculated as Fulton index (weight ratio of RV to LV + septum)), (d) cardiac output (CO), (e) stroke volume (SV), (f) representative quantification of cardiac fibrosis from the PAB-rats RV samples stained with Masson’s trichrome for control, compensated RV (cRV) and decompensated RV (dRV) states. (g) Representative quantification of H&E staining for cardiomyocyte cross-sectional area (CSA) representing cardiomyocyte hypertrophy in the same RV samples. Data are presented as mean ± SEM. (P value has been calculated by one-way ANOVA followed by Tukey’s multiple comparisons test). In all the box plots: Central bands represents 50% quantile (median), box interquartile ranges: 25–75%, and whiskers set to max/min, 1.5 IQR above/below the box. Number of samples (n) in each group of comparison=5. PAB-induced PH has been evaluated by significant elevations of RVSP, TPR, and RV hypertrophy in compensated RV state, while RVEDP was distinctly altered in decompensated RV, which along with clinical RV failure signs enabled us to clearly distinguish the decompensated from compensated RV condition in PAB rats. However, cardiac output (CO), as well as stroke Volume (SV) were continuously reduced in PAB rats unlike the MCT model.

