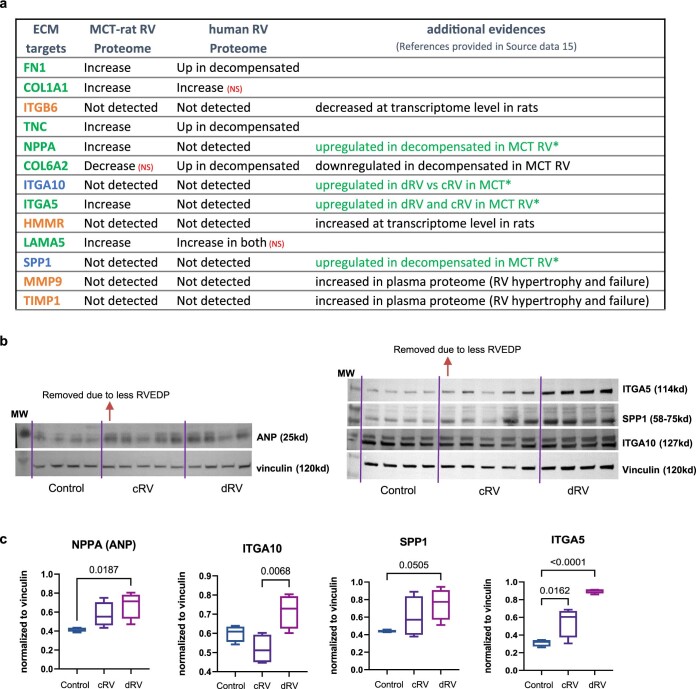
Extended Data Fig. 4. Public proteome and Western blot validation of selected ECM proteins in MCT-RV and human RV.
(a) Summary of 13 non-biomarker targets associated with ECM from the transcriptome analysis, along with their evidence of protein expression levels in animal models and human RV from publicly available datasets. The western blot analysis results has been highlighted in green in the third column. (b) Western blot images for ANP, ITGA5, ITGA10, and SPP1, in control (n = 4), cRV (n = 5) and dRV (n = 4) samples from MCT-induced rats. ANP is loaded in a separate blot from three other proteins. (c) Western blot quantifications for ANP, ITGA5, ITGA10, and SPP1 normalized to the corresponding loading control of each blot (Vinculin). Protein expression levels has been tested by one-way ANOVA followed by Dunnett’s multiple comparisons test (exact P-value has been demonstrated when significant). Data are presented as mean ± SEM. In all the box plots: Central bands represents 50% quantile (median), box interquartile ranges: 25–75%, and whiskers set to max/min, 1.5 IQR above/below the box.

