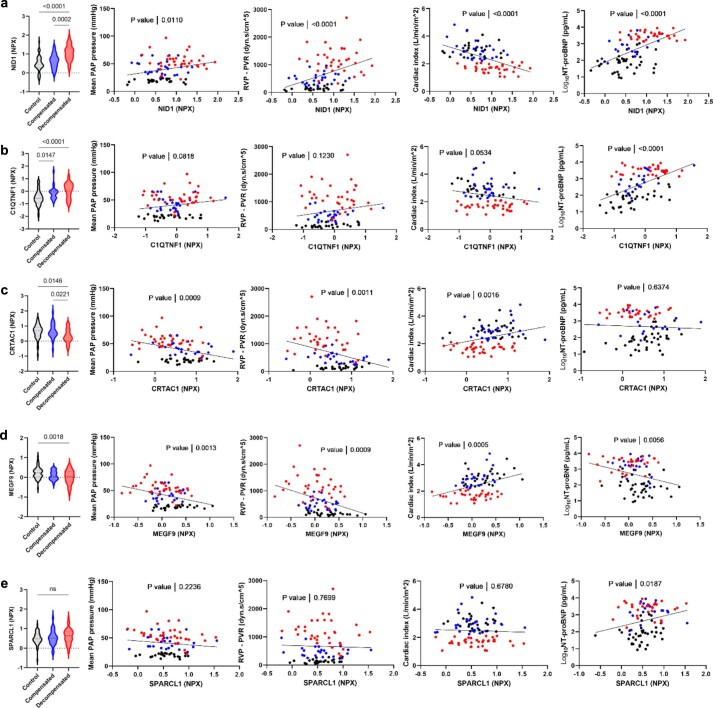
Extended Data Fig. 6. Expression and functional correlation of selected biomarker candidates in UK cohort.
Protein expression levels (NPX), and simple linear regression for each protein with RV functional parameters in two groups of PAH patients as well as controls. (a) NID1 expression was significantly correlated with all the hemodynamics parameters, negatively with Cardiac Index, while positively with mPAP and PVR as well as proBNP levels. (b) C1QTNF1 expression was positively correlated only with proBNP levels. (c, d) CRTAC1 and MEGF9 were both significantly correlated with all the clinical parameters, negatively with mPAP and PVR, and positively with Cardiac Index. (e) SPARCL1 did not show any significant correlation with measured clinical parameters except for a positive correlation with proBNP levels. Protein expression levels has been tested by one-way ANOVA followed by Turkey’s multiple comparison test. Data are presented as mean ± SEM. Simple linear regression has been applied to calculate the P-value of protein expression corrlation vs RV functional parameters. (mPAP = mean pulmonary arterial pressure, PVR = pulmonary vascular resistance, CI = Cardiac Index).

