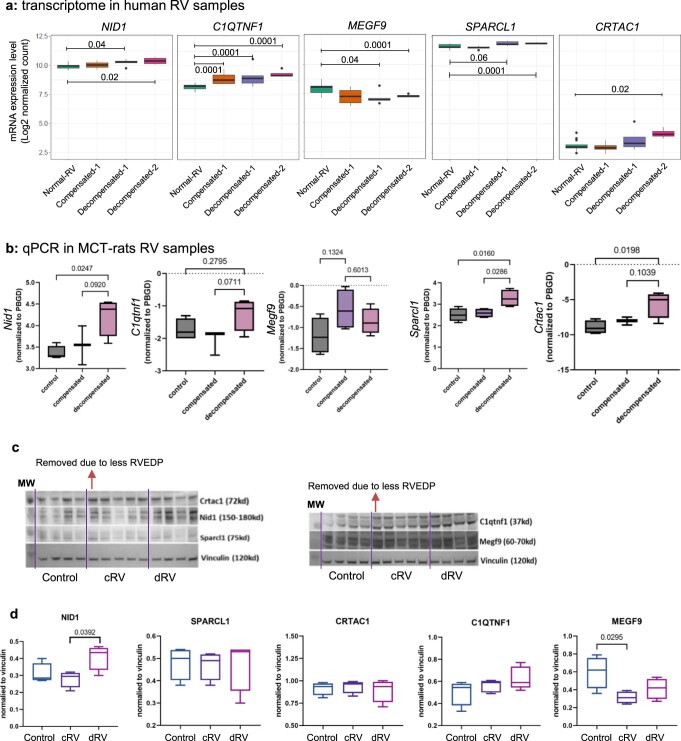
Extended Data Fig. 7. Transcriptome, qPCR and Western blot validation of selected biomarkers in human and MCT-induced rat RV.
(a) Transcriptome level of five biomarker genes associated with ECM in normal (n = 13), compensated (n = 4) and decompensated-1 (n = 5), and decompensated-2 (n = 4) subgroups of RV. Central band: 50% quantile, box: interquartile range (25–75%); whiskers: max/min are 1.5 IQR above/below the box. (b) Relative mRNA expressions measured by qPCR for 5 selected biomarkers in control (n = 5), compensated (n = 5) and decompensated RVs (n = 5) from MCT-induced rats. (c) Western blot images for NID1, SPARCL1, CRTAC1, C1QTNF1, and MEGF9 in control (n = 4), cRV (n = 5) and dRV (n = 4) samples from MCT-induced rats. First three proteins are loaded in a separate blot from two others. (d) Western blot quantifications for 5 selected proteins, normalized to the corresponding loading control of each blot (Vinculin). Both mRNA and protein expression levels has been tested by one-way ANOVA followed by Tukey’s multiple comparisons test. Exact P-value has been demonstrated where significant. Data are presented as mean ± SEM. In all the box plots: Central bands represents 50% quantile (median), box interquartile ranges: 25–75%, and whiskers set to max/min, 1.5 IQR above/below the box.

