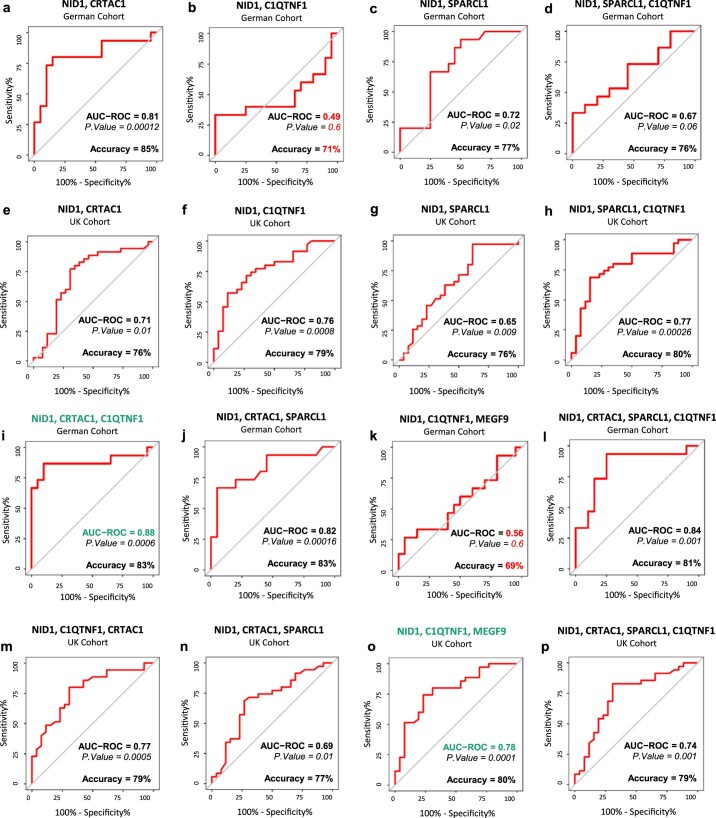
Extended Data Fig. 8. Combination of five proposed biomarkers can predict compensated vs decompensated in both cohorts.
ROC curves (associated AUCs and accuracy) indicating Random forest model performance in classifying patients with compensated or decompensated RV in each cohort independently. P-value has been calculated using one-sided Mann-Whitney (Wilcoxon-based) test for the H0: AUC = 0.5, and not corrected for multiple comparison as not applicable here. (a–p) Different combinations of proteins from panel of five has been tested to find the most effective features in prediction of RV states. Combination of NID1 + C1QTNF1 + CRTAC1 in German cohort (i) and NID1 + C1QTNF1 + MEG9 in validation cohort (o) are the most significant classifying features (highlighted in green).

