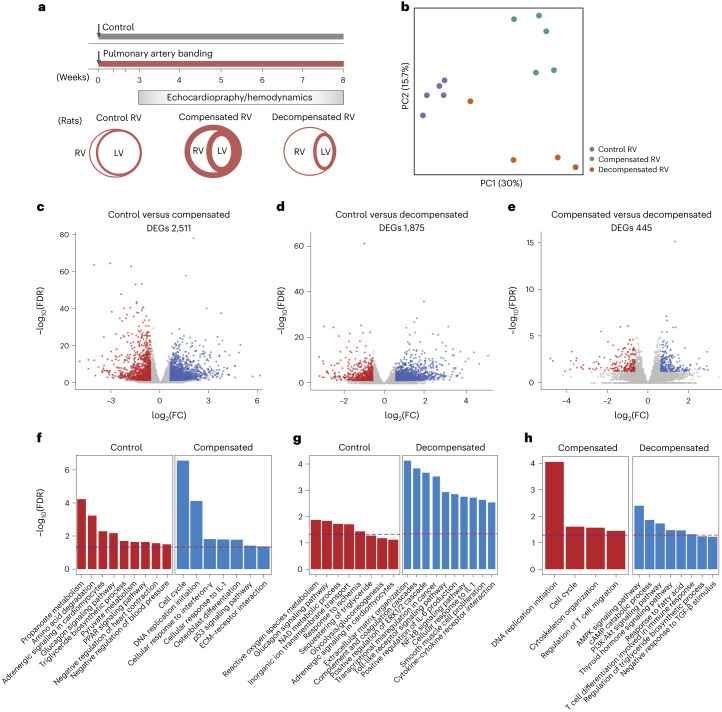
Fig. 2. Transcriptomic analysis of the right ventricle in a rat model of pulmonary artery banding.
a, Experimental design for the hemodynamic and transcriptomic characterization of RV samples in control (normal), compensated and decompensated states from rats subjected to PAB. b, PC analysis was performed on normalized RNA-seq data to visualize the gene expression profiles of all the RV samples. Control RV samples are shown in purple, compensated RV samples in green, and decompensated RV samples in orange. c–e, Volcano plots show the significance of each expressed gene (−log10 FDR values on the y axis), plotted against the logarithmic fold change (log2FC values on the x axis), in each pair of comparisons. DEGs were identified by DESeq2 (base mean expression ≥ 5; −0.585 ≤ log2FC ≥ 0.585; FDR ≤ 0.05). (c) Compensated (blue) versus control RV (red) (c), decompensated (blue) versus control RV (red) (d) and decompensated (blue) versus compensated RV (red) (e). f–h, Top selected differentially enriched pathways for each pair of comparisons. Compensated versus control RV (f), decompensated versus control RV (g) and decompensated versus compensated RV (h). The dashed line shows FDR = 0.05.

