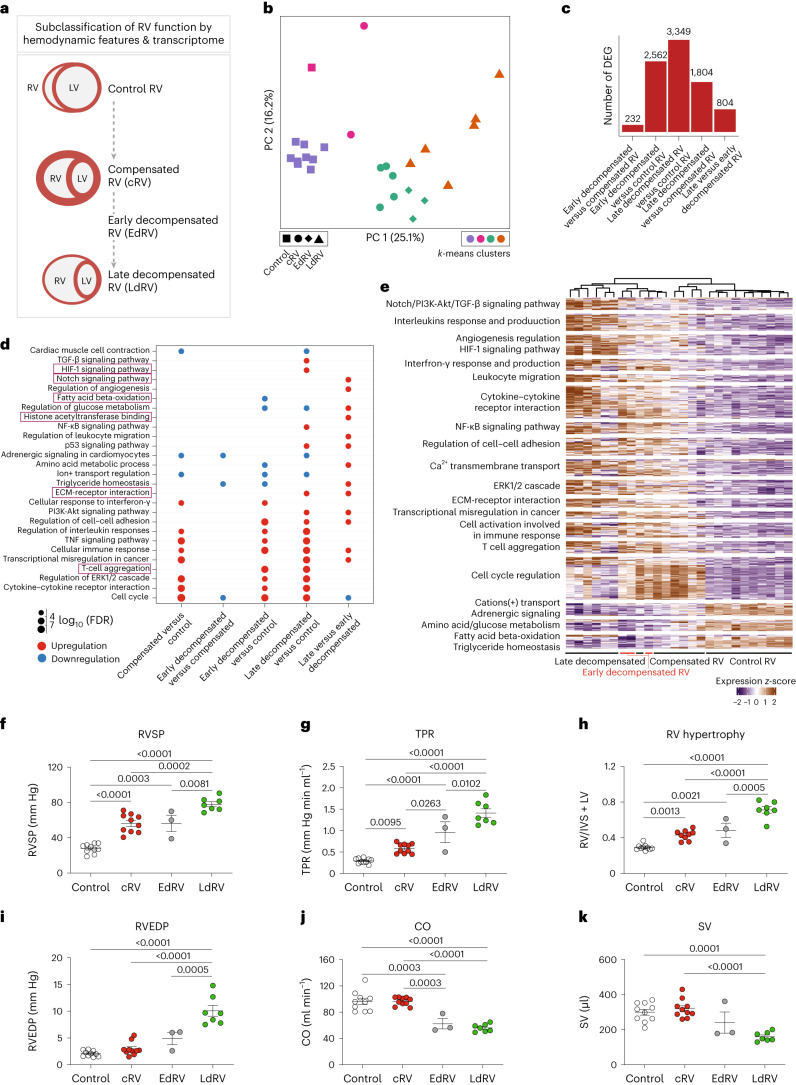
Fig. 5. Subclassification of decompensated state based on the transcriptome in MCT-induced pulmonary hypertension.
a, Schematic of the classification of RV function into normal, compensated and decompensated, along with a further subclassification of the decompensated RV into early and late states, based on both transcriptome and hemodynamic features. b, PC analysis was performed on the normalized RNA-seq data, in which the k-means clusters are demonstrated by different colors. Three early-decompensated RV samples clustered with the compensated group, while separated from other decompensated samples on both PCs. Different shapes represent different RV states. c, The number of DEGs that are significantly regulated in each pairwise comparison (base mean expression ≥ 5, −0.585 ≤ log2FC ≥ 0.585, FDR ≤ 0.05). d, Cumulative enrichment analysis demonstrating the shortlisted important pathways differentially regulated in each pair of RV subgroups. The size of the dots represents the FDR, the red color shows upregulation, while blue represents downregulation of a pathway in the respective pair. Distinguishing pathways regarding early- to late-decompensated RV transition is highlighted in red. One-sided Fisher’s exact test was used for all the enrichment analysis, which assesses the independent probability of any genes belonging to any set. FDR-corrected P value with Benjamini Hochberg method was used for multiple-hypothesis testing. e, Scaled gene expression (z-score) representation of the 576 cumulative DEGs corresponding to all the altered pathways associated with the transition from compensated to early- and late-decompensated RV in MCT-induced PH. Different groups of biological terms with similar regulation levels are highlighted along the y axis. f–k, Hemodynamic assessment of MCT-induced PH in rats confirmed changes in RV systolic pressure (RVSP; f), total pulmonary resistance (TPR; g), RV hypertrophy (right ventricular weight to left ventricular plus septal weight ratio; h), RV end-diastolic pressure (RVEDP; i), cardiac output (CO; j) and stroke volume (SV; k). n(control) = 10, n(compensated) = 10, n(early decompensated) = 3, n(late decompensated) = 7. Data are presented as the mean ± s.e.m. P values were calculated by one-way ANOVA followed by Tukey’s multiple-comparisons test.

