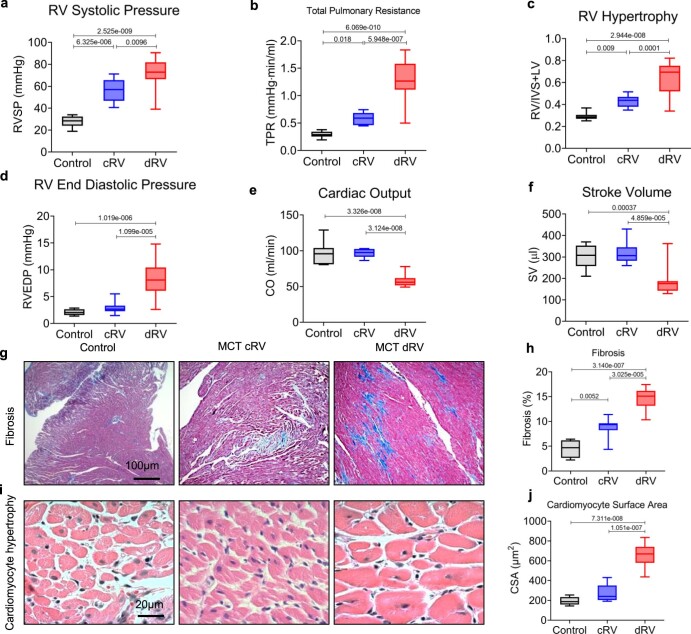
Extended Data Fig. 1. Hemodynamic assessment and RV function in MCT-induced PH rats.
Hemodynamic data collected by closed-chest right heart catheterization. RV hypertrophy was calculated as Fulton index (weight ratio of RV and (LV + septum)). (a) RV systolic pressure (RVSP), (b) total pulmonary resistance (TPR) (c) RV hypertrophy, (d) RV end-diastolic pressure (RVEDP), (e) cardiac output (CO). (f) Stroke volume (SV). Number of samples (n) in each group of comparison= 10. (g) Representative images of RV stained with Masson’s trichrome from control and MCT-treated rats with compensated RV (cRV) and decompensated RV (dRV) states. (h) Quantification of cardiac fibrosis in the same rat samples. (i) Representative images of RVs stained with H&E from control and MCT-treated rats. (j) Quantification of cardiomyocyte cross-sectional area (CSA) representing cardiomyocyte hypertrophy (from the same rat samples). (h, j) n(control)=4, n(compensated) = 9, n(decompensated)=9. Data are presented as mean ± SEM. (P value has been calculated by one-way ANOVA followed by Tukey’s multiple comparisons test). In all the box plots: Central bands represents 50% quantile (median), box interquartile ranges: 25–75%, and whiskers set to max/min, 1.5 IQR above/below the box.

