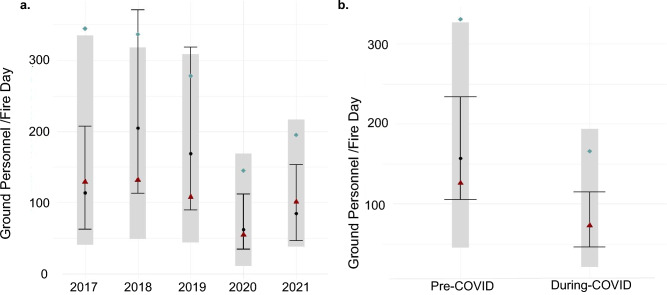
Figure 3.
(a,b) Predicted and observed ground personnel used per fire day by (a) year and across the (b) pre-COVID (2017–2019) and during-COVID (2020–2021) time periods across the western U.S. The black boxplots show the predicted mean ground personnel per fire day and the approximate 95% confidence intervals around the mean for each year. The blue diamonds represent the observed mean, the red triangles represent the observed median ground personnel per fire day, and the gray bars show the observed interquartile range. For the pre- and during-COVID group comparison, the estimated mean ground personnel from the GLMMs was averaged over the respective years.

