
Figure 4.
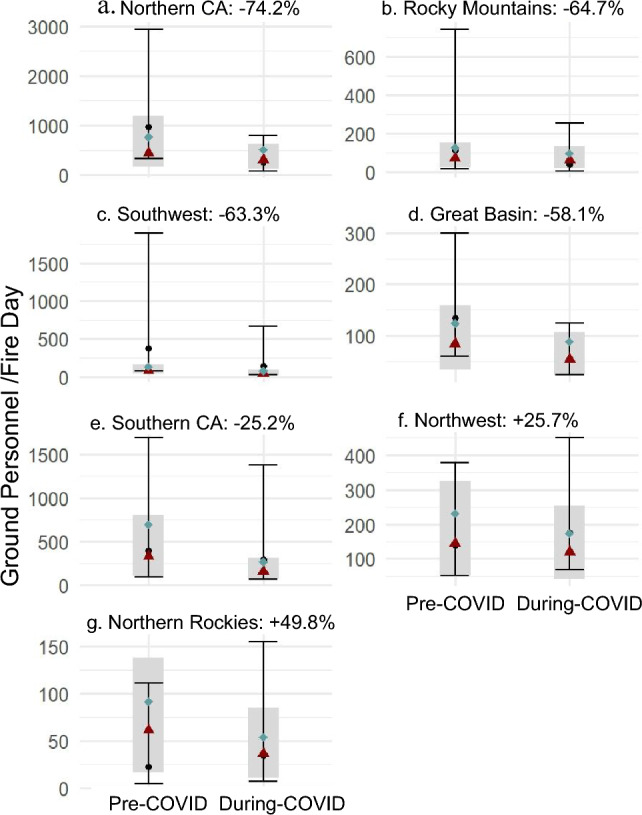
(a–g) Predicted ground personnel per fire day for each year according to GLMMs developed for each western fire region. The black boxplots show the predicted mean ground personnel per fire day and the approximate 95% confidence intervals around the mean for each year. The blue diamonds represent the observed mean, the red triangles represent the observed median ground personnel per fire day, and the gray bars show the observed interquartile range. The percentage change shown next to the name of each fire region reports the pre- to during-COVID change in the mean ground personnel used per fire day.