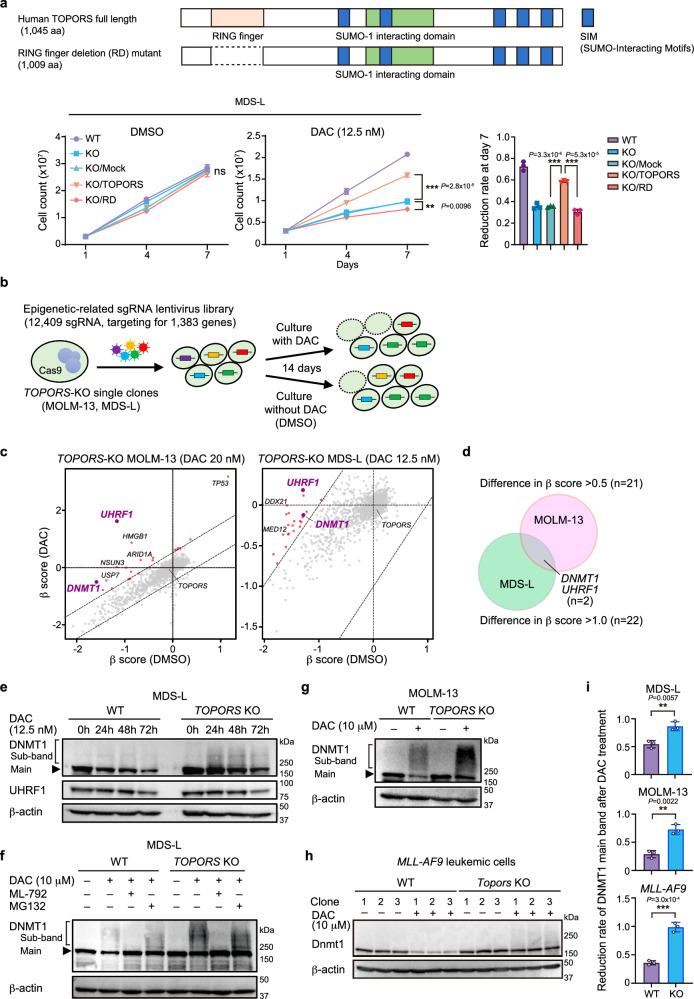
Fig. 5. DNMT1 is stabilized in TOPORS-KO cells.
a Effects of TOPORS and TOPORS-RD add-back on TOPORS-KO MDS-L cell growth in the presence and absence of 12.5 nM DAC (n = 3 for each group, biological replicates). Reduction rate of cell numbers on day 7 of culture compared to those of WT MDS-L cells are depicted (right). Full-length TOPORS with silent mutations (CGC to AGA) in the sgTOPORS#1 target sequence was used. b Outline of the second CRISPR-Cas9 screening using TOPORS-KO single-cell clones with and without DAC. c Scatter plots showing the β-scores of each gene in the presence and absence of DAC. Candidate genes with proportionally increased sgRNA read counts during culture in the presence of DAC compared to those in the absence of DAC are indicated by red and purple dots. d Venn diagram showing the two overlapping candidate genes, UHRF1 and DNMT1, between MOLM-13 and MDS-L screenings. e Changes in DNMT1 and UHRF1 protein levels after exposure to low-dose DAC (12.5 nM) in WT and TOPORS-KO MDS-L cells. Unmodified (main band) and modified (sub-band) DNMT1 are indicated. The samples derive from the same experiment but different gels for DNMT1, β-actin, and another for UHRF1 were processed in parallel. f DAC-induced SUMOylation and degradation of DNMT1. WT and TOPORS-KO MDS-L cells were exposed to a high dose of DAC (10 µM) for 8 h in the presence and absence of the SUMO inhibitor, ML-792 (3 µM), or the proteasome inhibitor, MG132 (20 µM). Unmodified (main band) and modified (sub-band) DNMT1 are indicated. Changes in DNMT1 protein levels after exposure to high-dose DAC (10 µM) for 8 h in WT and TOPORS-KO MOLM-13 cells (g) and mouse MLL-AF9 leukemic cells (h). i Reduction rate of DNMT1 unmodified main bands after DAC treatment. Intensity of DNMT1 main bands after DAC treatment in (g, h, and i) relative to those before DAC treatment are indicated (n = 3 for each group, independent replicates). **p < 0.01; ***p < 0.001; n.s., not significant by unpaired two-tailed Student’s t-test. Data are presented as mean ± SD. Source data are provided as a Source Data file.

