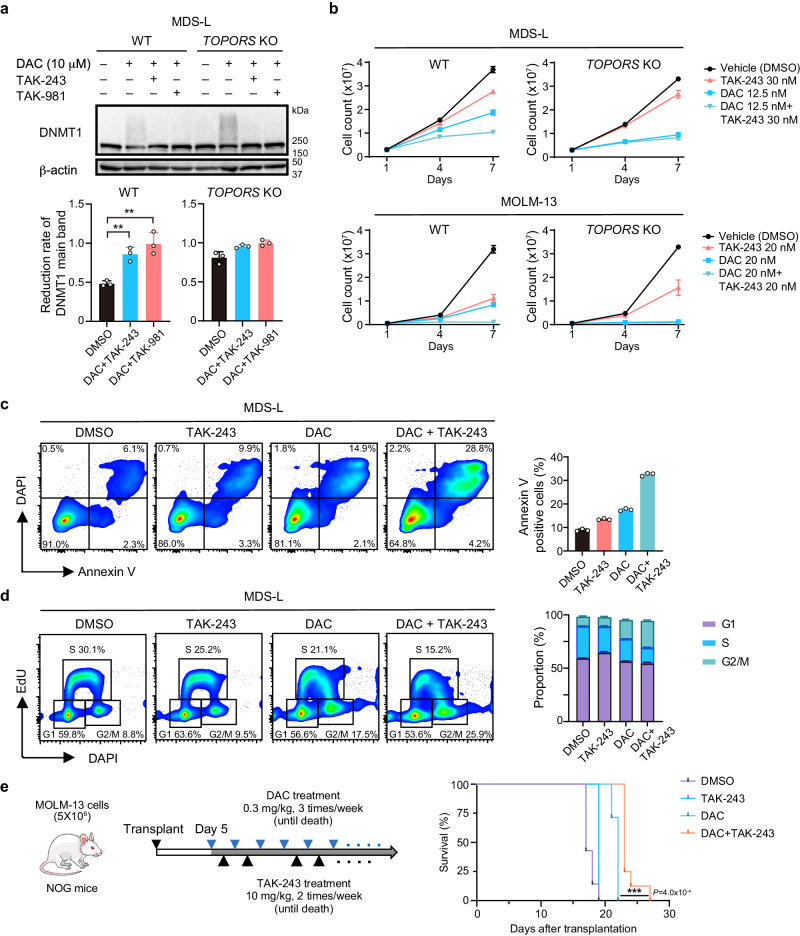
Fig. 7. Pharmacological intervention induces mitotic defects via DNMT1 stabilization.
a Changes to DNMT1 protein levels after exposure to DAC in WT and TOPORS-KO MDS-L cells. The cells were exposed to a high dose of DAC (10 µM) for 8 h in the presence and absence of TAK-243 (1 µM), or TAK-981 (3 µM) (n = 3 for each group, independent replicates). b Growth of WT and TOPORS-KO MDS-L clones in the presence and absence of DAC and/or TAK-243 (n = 3 for each group, technical replicates, the experiments were repeated twice independently). c Frequency of apoptotic cell death in MDS-L cells after exposure to 12.5 nM of DAC. Representative flow cytometric profiles of cells at 72 h of DAC exposure (left panel). Percentage of Annexin V-positive cells (n = 3 for each group, technical replicates, the experiments were repeated twice independently) (right panel). d Cell cycle status of WT and TOPORS-KO MDS-L cells 72 h after exposure to DAC (12.5 nM) and/or TAK-243 (30 nM). Representative flow cytometric profiles of cells (left panel). Proportion of each cell cycle evaluated by EdU incorporation and DAPI staining (n = 3 for each group, technical replicates, the experiments were repeated twice independently) (right panel). e In vivo treatment of MOLM-13 cells with the combination of DAC and TAK-243. WT MOLM-13 cells were transplanted into NOG mice. The recipient mice were treated with DAC and/or TAK-243 until they died. Treatment timing and overall survival are depicted (n = 7 for each group, biological replicates). **p < 0.01; ***p < 0.001; n.s., not significant by unpaired two-tailed Student’s t-test. Data are presented as mean ± SD. Source data are provided as a Source Data file.

