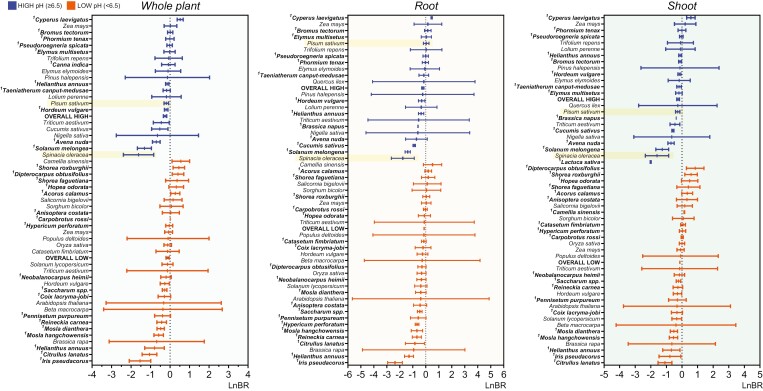
Fig. 2.
Plants’ sensitivity to ammonium can be assessed using a biomass-based indicator. Forest plots graphs depict the standardized mean effect sizes and 95% confidence intervals of sole ammonium source versus nitrate (LnBR) under high or low empirical pH (represented by symbol color) on dry weight biomass of the whole plant (A), root (B), and shoot (C) in the 50 examined plant species. An effect size of zero is indicated by a dotted line. The LnBR shows different responses in spinach and pea (highlighted in yellow). The pooled effect sizes of LnBR for the low and high pH conditions of the hydroponic nutrient solutions used in the studies are represented by OVERALL LOW and HIGH, respectively. Species in bold with superscripts were manually included in the forest plots; however, due to a shortage of studies, they were not included in the meta-analysis. See Supplementary Table S1 for reference information on the selected studies.

