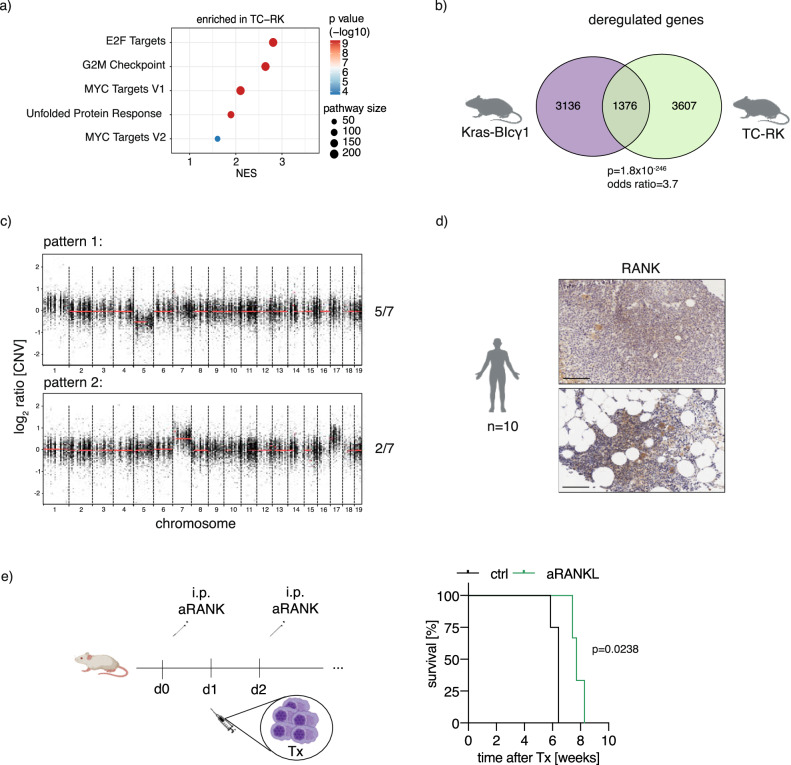
Fig. 6. Comparative analysis between TC-RK induced myeloma and both other murine MM mouse models and human disease.
a GSEA analysis showing hallmarks enriched in splenic plasma cells of TC-RK mice compared to plasma cells of RK mice. NES, normalized enrichment score. b Venn diagram depicts the overlap of deregulated genes in myeloma cells from Kras-BIγ1 mice [33] and TC-RK mice. Fisher’s exact test was applied and both p value and odd ratio are depicted. Illustrations were generated using BioRender.com. c Representative copy number variation patterns of myeloma cells from TC-RK mice (n = 7). d Representative immunohistochemistry staining of primary patient biopsies confirmed RANK expression in myeloma cells. Illustrations were generated using BioRender.com. e Treatment schedule of xenograft model with anti-RANKL antibody prior and after injection of L363 in NSG mice (top) and Kaplan-Meier survival analysis (bottom) is shown for NSG mice received anti-RANKL (n = 3) or vehicle (n = 4) therapy prior and after L363 transplantation (Tx L363). Statistical significance with corresponding p values calculated by log-rank (Mantel-Cox) test is depicted in the graph. Graph represents one out of three independent experiments.

