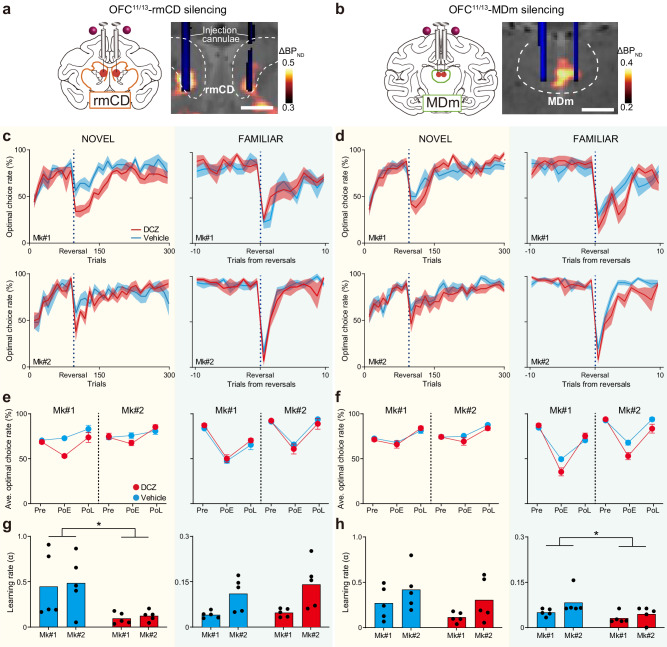
Fig. 3. OFC11/13-rmCD and OFC11/13-MDm pathways are necessary for experience- and inference-based value-updating, respectively.
Chemogenetic silencing of the OFC11/13-rmCD (a) and OFC11/13-MDm (b) pathways by local DCZ infusion into either bilateral rmCD or MDm, specifically at hM4Di-positive OFC terminal sites. A CT image showing the infusion cannulae (blue) overlaying a structural MR image (gray), and a PET image showing a high [11 C]DCZ binding region (hM4Di expression, hot color) obtained from Mk#2. The dashed lines represent the borders of the caudate nucleus and mediodorsal thalamus, respectively. c,d, Optimal choice rate in the NOVEL (left) and FAMILIAR (right) tasks after silencing the OFC11/13-rmCD (c) and OFC11/13-MDm (d) pathways. Solid lines and shaded area represent the mean and s.e.m, respectively. Averaged optimal choice rate for each phase in the NOVEL (left) and FAMILIAR (right) tasks after silencing the OFC11/13-rmCD (e) and OFC11/13-MDm (f) pathways. For silencing the OFC11/13-rmCD pathways, a three-way ANOVA (subject × phase × treatment) revealed a significant main effect of treatment (F(1,48) = 9.6, p = 3.2 × 10⁻³) and a significant interaction between phase and treatment (F(2,48) = 5.5, p = 7.1 × 10⁻³) in the NOVEL task, but not in the FAMILIAR task (treatment, F(1,48) = 0.02, p = 0.88; interaction, F(2,48) = 0.26, p = 0.77). Subsequent two-way ANOVAs (subject × treatment) for each phase revealed significant differences for treatment during the PoE (F(1,16) = 32.2, p = 3.4 × 10⁻⁵), but not during the Pre (F(1,16) = 0.03, p = 0.86) or the PoL (F(1,16) = 0.33, p = 0.57) of the NOVEL task. Note that there was a significant interaction during the PoE (F(1,16) = 5.5, p = 3.2 × 10⁻²), with a significant difference (Mk#1, t(8) = 8.5, p = 3.7 × 10⁻⁵) and a tendency (Mk#2, t(8) = 1.9, p = 0.09), as determined by individual Welch’s t-tests. After silencing the OFC11/13-MDm pathways, a three-way ANOVA (subject × phase × treatment) revealed a significant main effect of treatment (F(1,48) = 9.4, p = 3.6 × 10⁻³) and a significant interaction between phase and treatment (F(2,48) = 8.5, p = 7.2 × 10⁻⁴) in the FAMILIAR task, but not in the NOVEL task (treatment, F(1,48) = 1.2, p = 0.27; interaction, F(2,48) = 0.60, p = 0.55). Subsequent two-way ANOVAs (subject × treatment) for each phase revealed significant differences for treatment during the PoE (F(1,16) = 18.1, p = 6.1 × 10⁻⁴), but not during the Pre (F(1,16) = 1.1, p = 0.31) or the PoL (F(1,16) = 0.73, p = 0.41) of the FAMILIAR task. Error bars: s.e.m. Estimated learning rates after silencing the OFC-rmCD pathway during the NOVEL (g, left, two-way ANOVA, treatment, F(1,16) = 11.0, p = 4.4 × 10⁻³; subject, F(1,16) = 0.10, p = 0.76; interaction, F(1,16) = 0.0022, p = 0.96) and FAMILIAR (g, right, treatment, F(1,16) = 0.74, p = 0.40; subject, F(1,16) = 14.1, p = 1.8 × 10⁻³; interaction, F(1,16) = 0.30, p = 0.59) tasks, and the OFC-MDm pathway during the NOVEL (h, left, treatment, F(1,16) = 2.5, p = 0.14; subject, F(1,16) = 3.9, p = 0.07; interaction, F(1,16) = 0.059, p = 0.81) and FAMILIAR (h, right, treatment, F(1,16) = 5.7, p = 2.9 × 10⁻²; subject, F(1,16) = 3.7, p = 0.07; interaction, F(1,16) = 0.61, p = 0.45) tasks. Additional analysis using three-way ANOVA (subject × treatment × injection area) during the Po1 phase revealed significant interactions between treatment and injection area in both tasks (NOVEL, F(1,32) = 6.1, p = 1.9 × 10⁻²; FAMILIAR, F(1,32) = 6.6, p = 1.5 × 10⁻²), indicating that the effects of DCZ infusion into different areas were significantly different. Data were obtained from N = 5 sessions for each treatment, each task, and each monkey. Scale bars: 5 mm.

