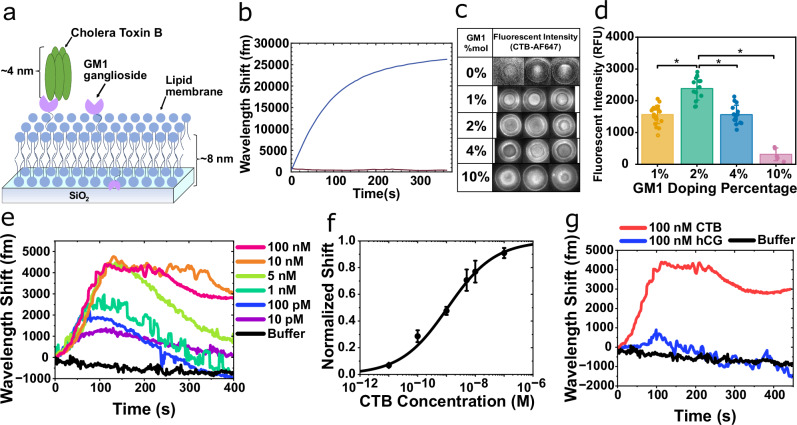
Fig. 2. GM1-CTB binding signals.
a Schematic model of pentameric CTB bound to a GM1-DOPC lipid membrane silica microtoroid. b Wavelength shift from GM1-DOPC lipid vesicles adsorbing onto the silica toroid. c Fluorescent images of 50 nM CTB-AF647 binding to varying % mol fraction GM1 in DOPC coated-microtoroids. d Fluorescent intensity determined from the fluorescent assay in (c). Bars and whiskers show the mean ± SD from biological repeats (for 1% (n = 21), 2% (n = 13), 4% (n = 15), and 10% (n = 5)). Statistical significance was determined using a one-way ANOVA, *p < 0.0001. e Wavelength shift as CTB binds to a GM1-DOPC functionalized toroid. f Dose–response binding curve generated based on the maximum wavelength shift from (e). Data are mean ± SEM from 3 independent experiments. g Control experiment attempting to detect an irrelevant protein (human chorionic gonadotropin, hCG) binding to the GM1-DOPC coated microtoroid.

