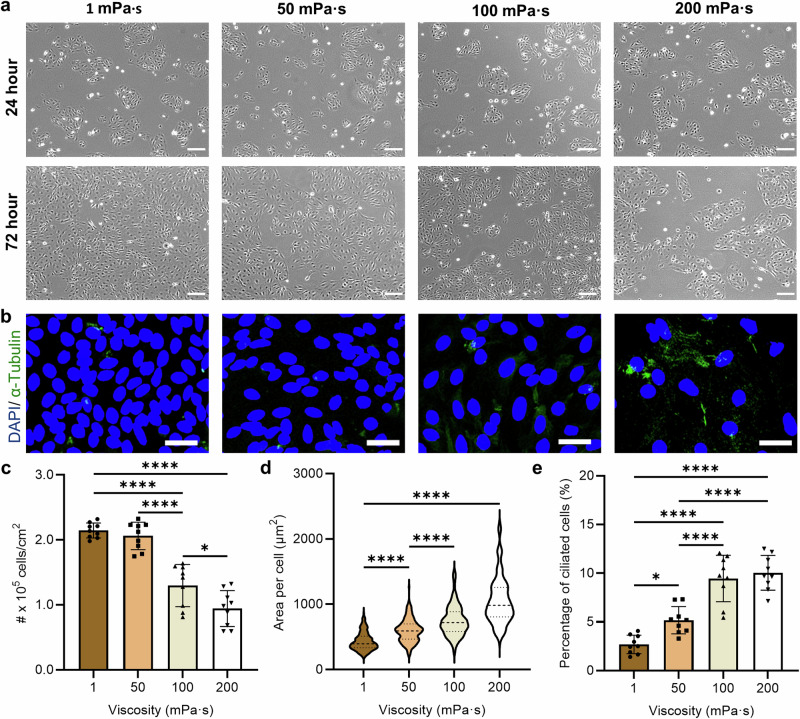
Fig. 1. Effect of culture media viscosity on the development of the fallopian tube epithelial cells (FTEC).
a Representative phase contrast images of FTEC 24 h (top) and 72 h (bottom) post-seeding as a function of culture media viscosity ranging from 1 mPa·s to 200 mPa·s. b Representative immunofluorescent images of FTEC 72 h post-seeding, where the green stain indicates the cilia and the blue stain indicates nuclei. Scale bars, 30 µm. c Epithelial cell density (number of cells per cm2, n = 9 images from three biological replicates per each condition), d area per cell (n ≥ 200 single cells from three biological replicates per each condition), and e the proportion of ciliated cells as a function of viscosity (n = 9 images from three biological replicates per each condition), after 72 h of culture. Data are represented as mean ± s.d. and analysed using one-way ANOVA with Tukey post hoc testing, *P ≤ 0.05, **P ≤ 0.01, ***P ≤ 0.001 and ****P ≤ 0.0001. For exact P values see Supplementary Table 3. Source data are provided as a Source Data File.

