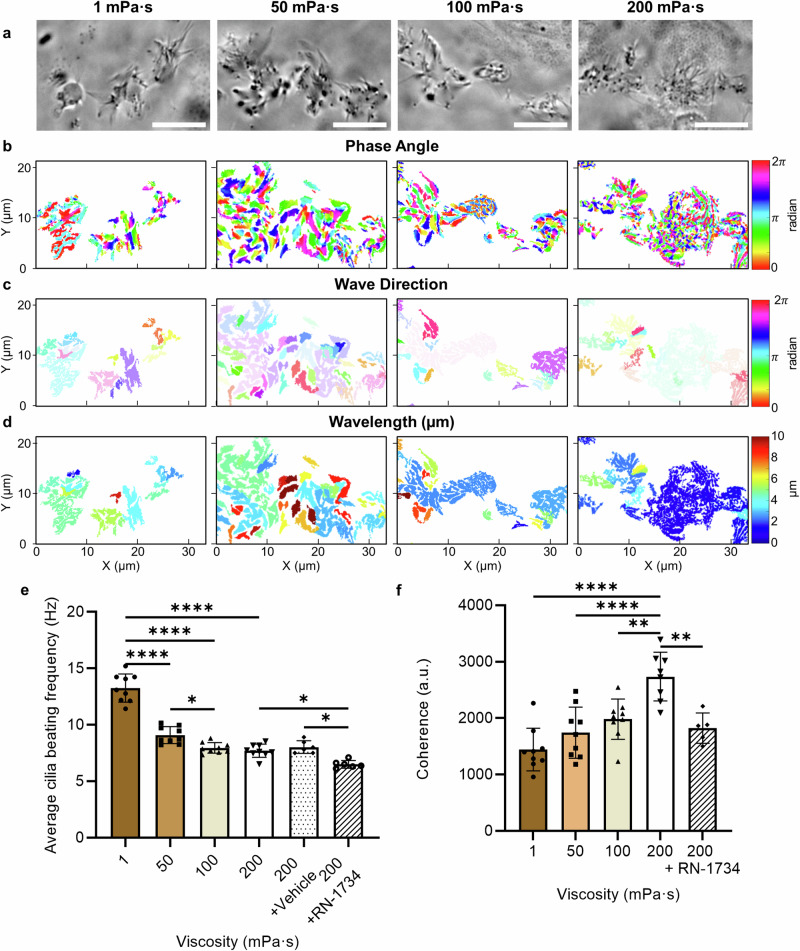
Fig. 4. Characterisation of cilia beating and coordination under viscous loading.
a Representative widefield images of live ciliated cells, and the corresponding (b) phase angle, (c) wave direction and (d) wavelength of beating cilia as a function of media viscosity. Scale bars, 10 µm. e Average cilia beating frequency, and f coherence (a measure of the cilia coordination) as a function of culture media viscosity and for cells treated with RN-1734 to block the TRPV4 channel, and for the vehicle control. Data are represented as mean ± s.d. and analysed using one-way ANOVA with Tukey post hoc testing, *P ≤ 0.05, **P ≤ 0.01 and ****P ≤ 0.0001, n = 9 images from three biological replicates per each condition. For exact P values see Supplementary Table 3. Source data are provided as a Source Data File.

