
Fig. 4. Method validation using mass spectrometry data.
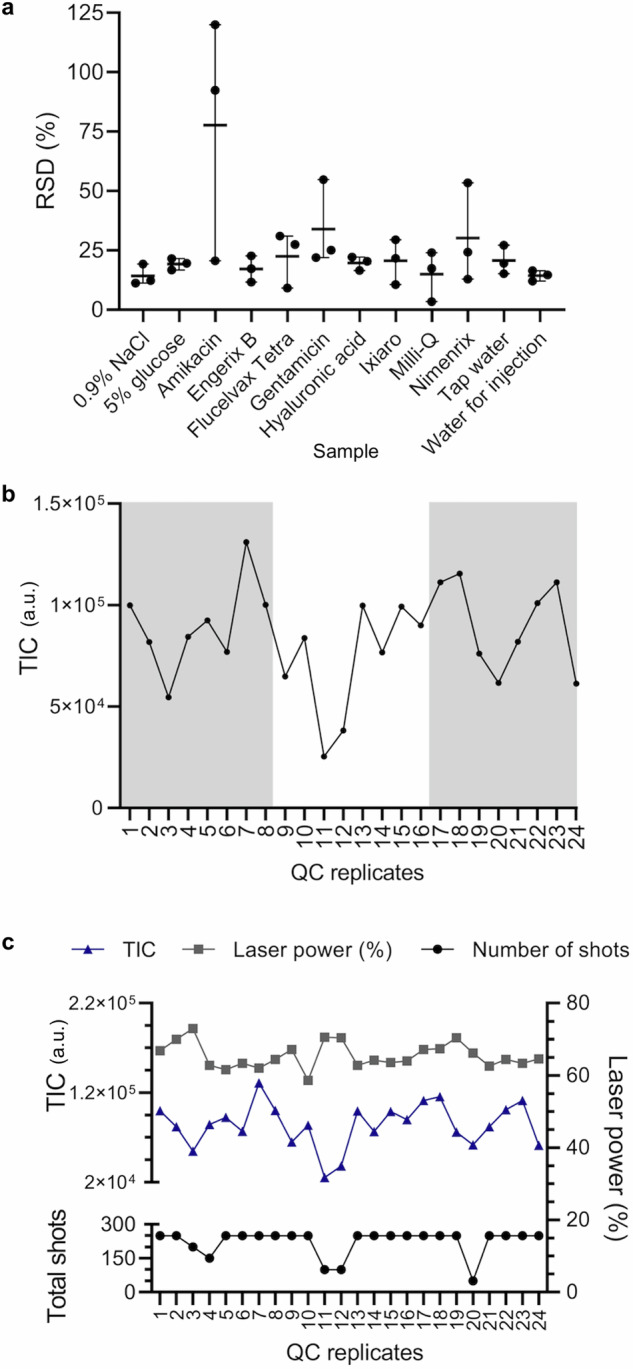
a The percentage relative standard deviation (RSD) values for each vial per sample are plotted showing the range and mean. b The total ion count (TIC) for each quality control (QC) sample replicate plotted in consecutive run order shows no particular bias (replicates spotted on different target plates are alternately shaded/white). c TIC, laser power, and number of shots of the laser for replicates plotted consecutively for each QC sample.