
Fig. 7. Biotyper Sirius partial least squares-discriminant analysis (PLS-DA) of authentic vaccine Engerix B and all falsified vaccine constituents, m/z 0–900.
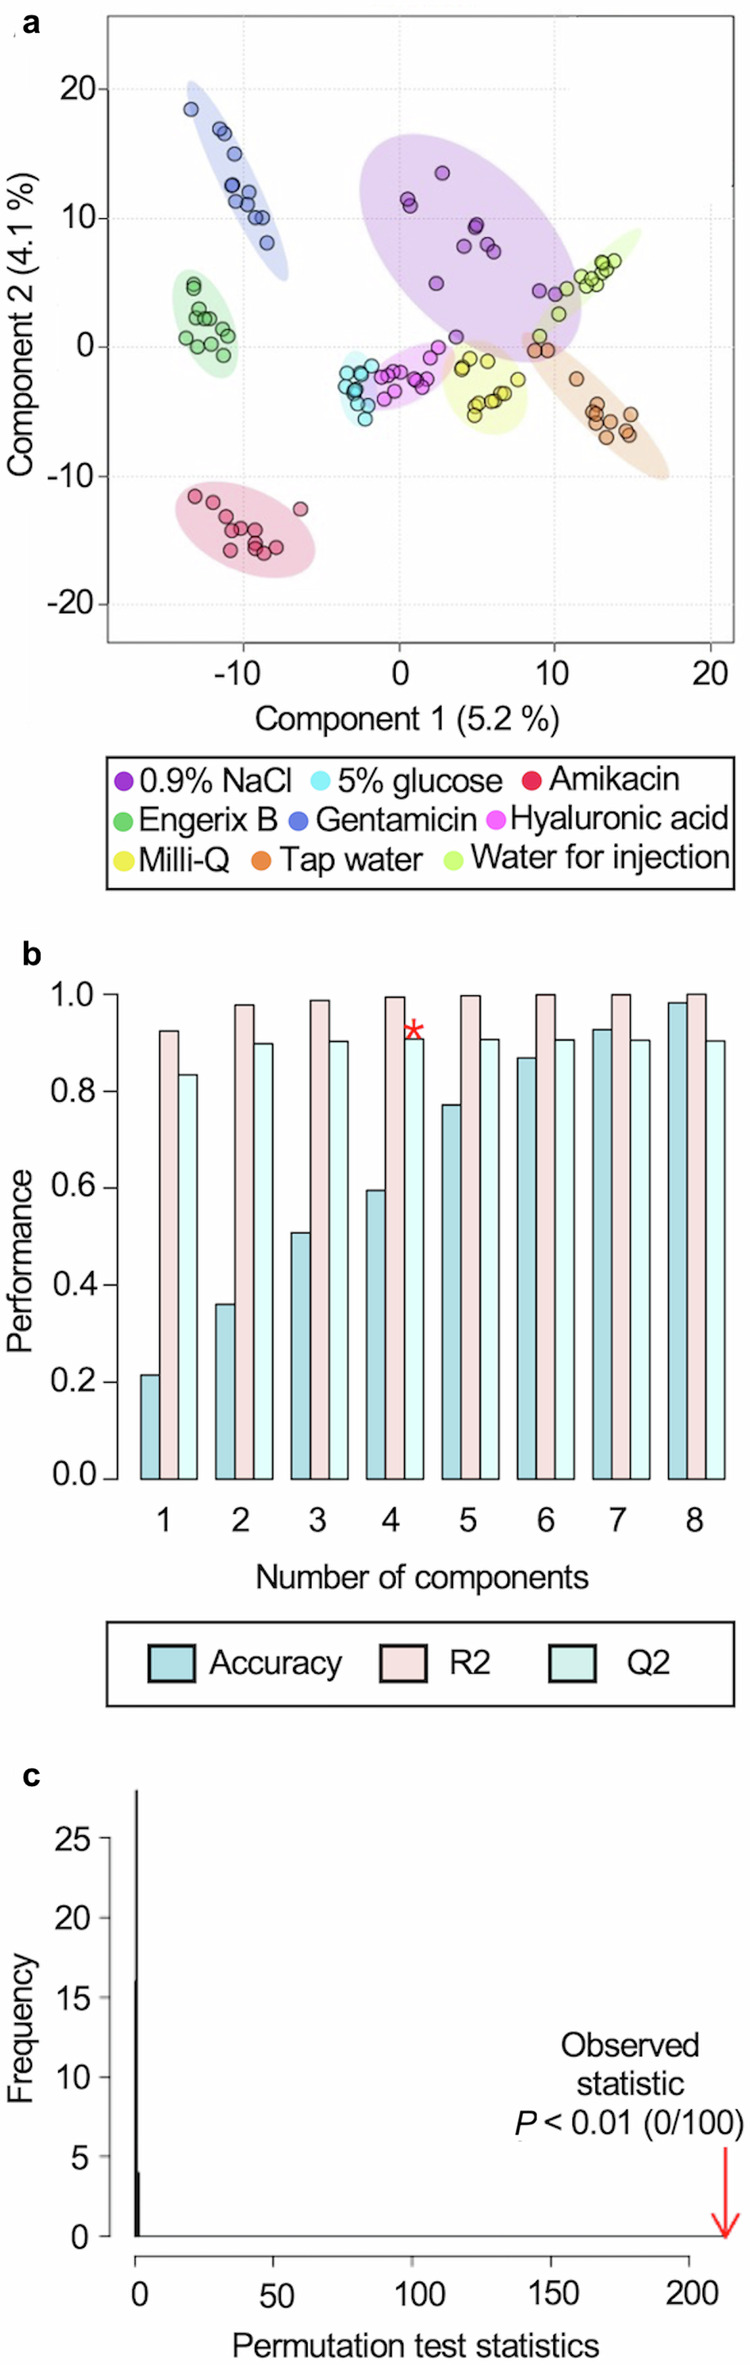
a PLS-DA two-dimensional scores plot shows sample group clustering. b Cross-validation shows a minimum of four components (mass spectral peaks) are required to differentiate the experimental groups for the best Q-squared (Q2) value (shown by *). Supplementary Table 3 gives the numerical values for the performance of accuracy, R-squared (R2) and Q2 in the cross-validation. The performance axis indicates the predictive ability of the model. c Permutation testing showed the model was significant with P < 0.01.