
Fig. 9. Bar graph of the numbers of m/z values and spectral peaks following two-way analysis of variance with Dunnett multiple comparison test between Engerix B and the falsified vaccine surrogates for Biotyper Sirius data.
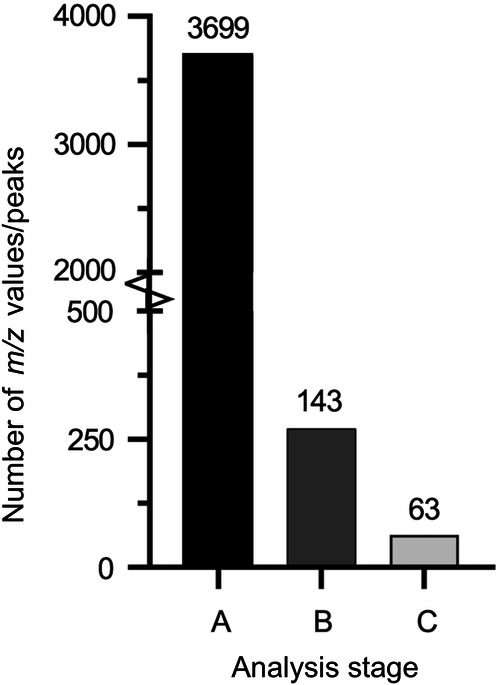
Bar A represents the 3699 total m/z values identified by MALDIquant peak detection and binning. B represents the 143 peaks in the raw spectra that yielded a statistically significant P value (P ≤ 0.05) for at least one falsified constituent compared to Engerix B. Bar C represents the 63 significant peaks in the raw spectra that have a clear presence in Engerix B and absence in at least one falsified constituent (or vice versa).