Fig. 2.
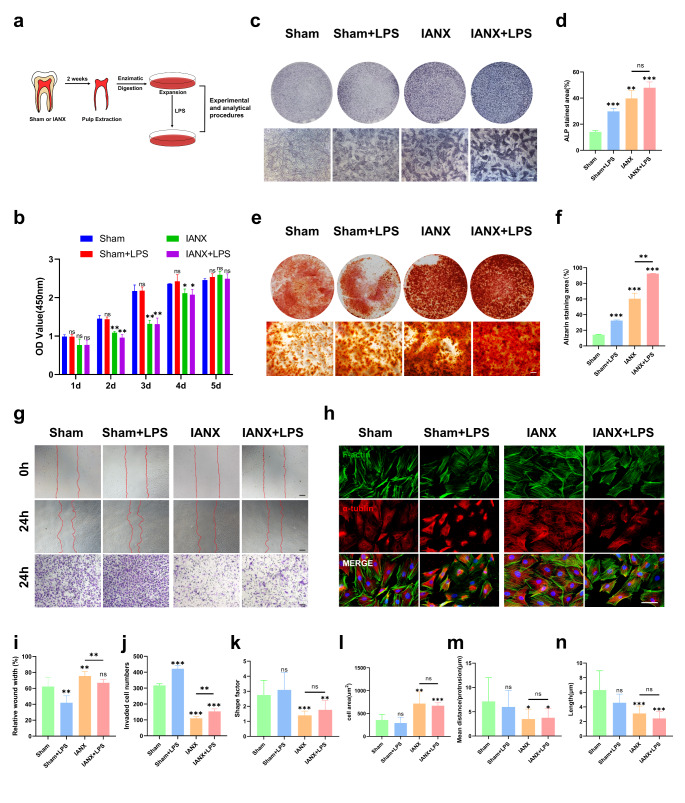
The sensory nerve-deficient microenvironment influences the behaviors of DPSCs. a Primary culture of dental pulp stem cells (DPSCs) from rat mandibular first molars. DPSCs were subsequently stimulated with LPS (1 µg/ml). b Cell proliferation was detected by CCK8 assay, OD values are shown as the mean ± SEM (**P < 0.01, *P < 0.05, ns, not significant, P > 0.05). c Alkaline phosphatase activity staining of DPSCs with different treatments. Scale bar = 100 μm. d Quantitative analysis of ALP activity (ALP positive area/total area) is presented in c (ns indicates P ≥ 0.05, **P < 0.01, ***P < 0.001, n = 3). e Alizarin red staining of DPSCs with different treatments. Scale bar = 100 μm. f Quantitative analysis of alizarin red staining was presented in e (**P < 0.01, ***P < 0.001, n = 3). g Representative images of wound healing and Transwell migration assays. Scale bar = 100 μm. h Cytoskeletal changes were assessed by immunofluorescence staining for F-actin (phalloidin, green) and α-tubulin (red). Scale bar = 100 μm. i Quantified results of wound healing assay in g (ns indicates P ≥ 0.05, **P < 0.01, n = 3). J Quantified results of Transwell assay in g (**P < 0.01, ***P < 0.001, n = 3). k Shape factor is the ratio of the major to the minor axis (ns indicates P ≥ 0.05, **P < 0.01, ***P < 0.001, n = 15). l Cell area is the area of a cross-section of the cell soma (ns indicates P ≥ 0.05, **P < 0.01, ***P < 0.001, n = 15). m Summary graph showing protrusion density (mean distance between protrusions) (ns indicates P ≥ 0.05, *P < 0.05, n = 15). n Protrusion length. ( ns indicates P ≥ 0.05, ***P < 0.001, n = 15)

