
Fig. 1.
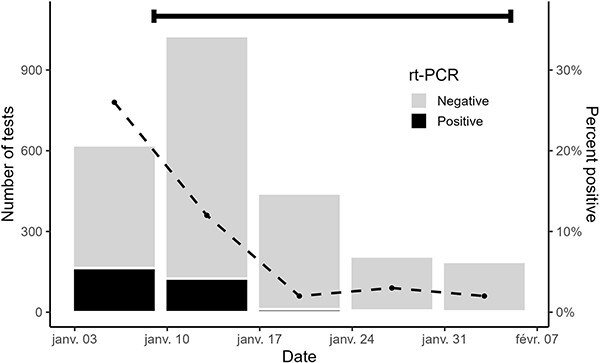
Number of RT-PCR tests conducted per week during the active AFCON screening program from January 3 to February 1, 2022. The black bar represents the number of positive RT-PCR tests (left axis). The dashed line represents the proportion of positive tests (right axis). The black horizontal bar indicates the time period of the AFCON.