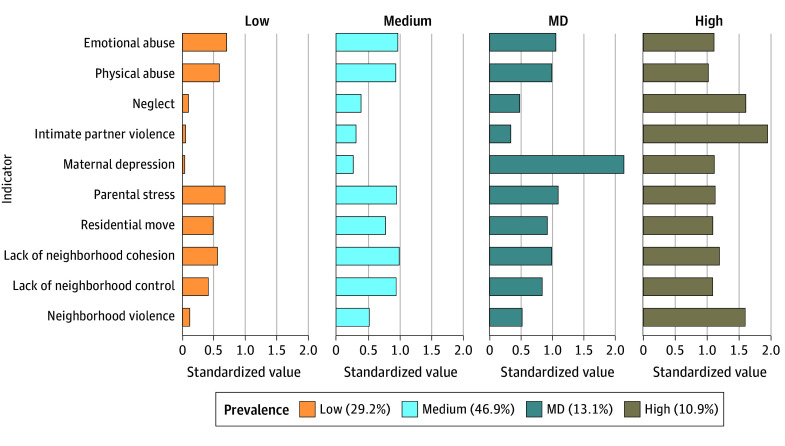
Figure 1. Standardized Values of Each Adversity Indicator in the 4-Class Model of Childhood Adversity Profiles.
Of 4210 individuals in the included sample, 1230 (29.2%) experienced the lowest rate of adversity, 1973 (46.9%) were exposed to medium-level adversity risk; and 457 (10.9%) experienced the highest level of risk across the 10 adversity types. A total of 550 individuals (13.1%) had similar levels of exposures with the medium-risk profile but with markedly elevated levels of maternal depression (MD) compared with all other profiles.

