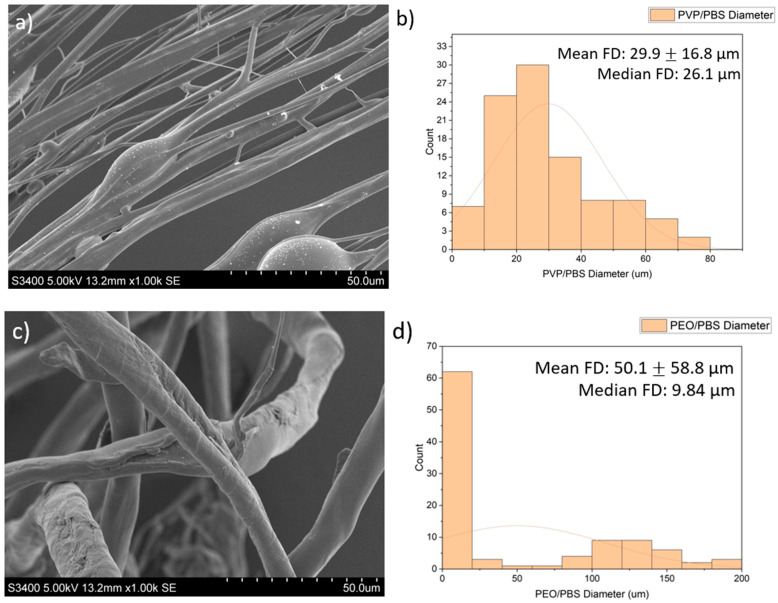
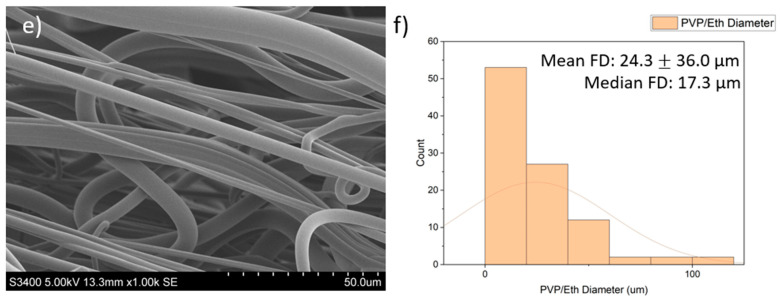
Figure 2.
Images of the PG fibres: (a) SEM images of PG PVP/PBS 25% fibres (scale bar = 50.0 μm); (b) histogram showing distribution of PG PVP/PBS 25% fibres (n = 100) with a line of best fit; (c) SEM images of PG PEO/PBS 20% fibres (scale bar = 50.0 μm); (d) histogram showing distribution of PG PEO/PBS 20% fibres (n = 100) with a line of best fit; (e) SEM images of PG PVP/ethanol 20% fibres (scale bar = 50.0 μm); (f) histogram showing distribution of PG PVP/ethanol 20% fibres (n = 100) with a line of best fit.


