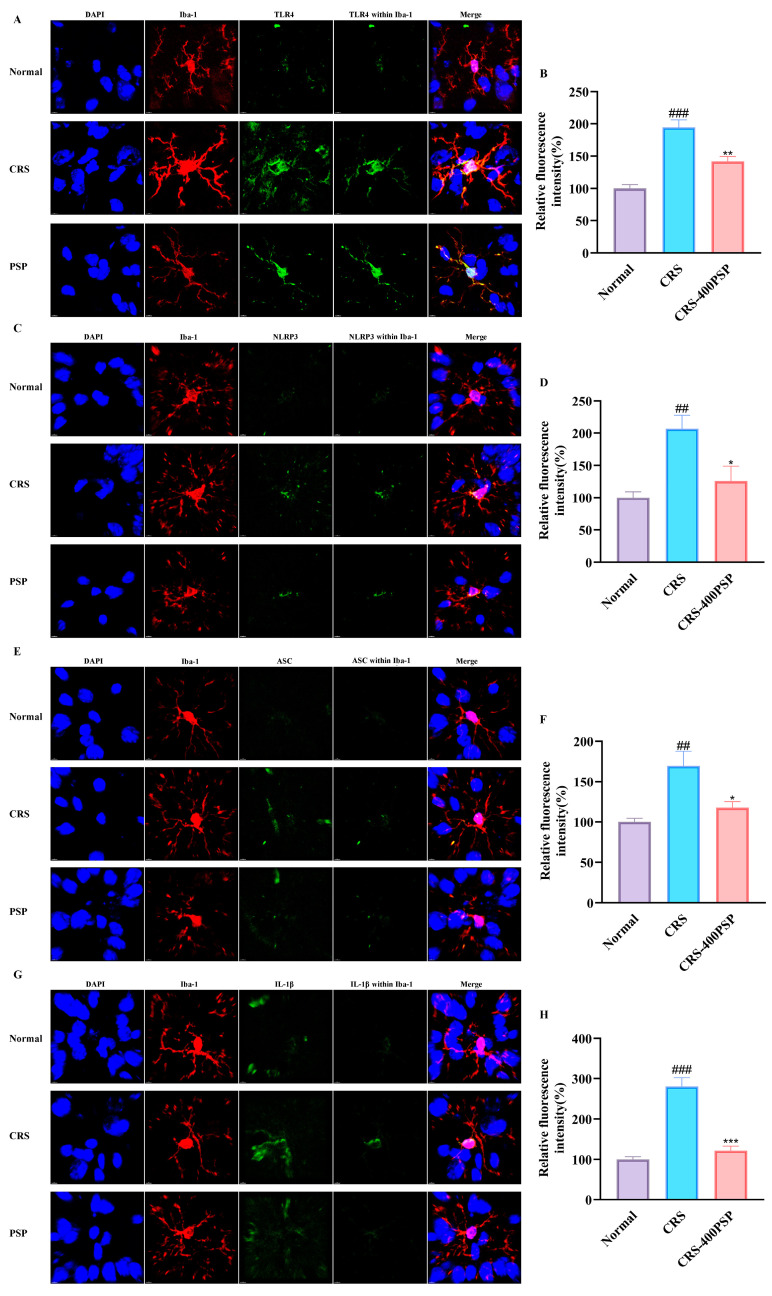
Figure 6.
Effects of PSP on inflammatory marker expression in prefrontal cortex microglia of CRS-induced mice. (A) Representative immunofluorescence staining images of TLR4 (green) expression in microglia (Iba-1, red) with DAPI (blue) staining. (B) Quantification shows increased TLR4 expression in the CRS group reduced by PSP treatment. (C) NLRP3 (green) expression images. (D) Quantification shows increased NLRP3 in the CRS group, reduced by PSP. (E) ASC (green) expression images. (F) Quantification shows increased ASC in the CRS group, reduced by PSP. (G) IL-1β (green) expression images. (H) Quantification shows a significant increase in IL-1β in the CRS group, significantly reduced by PSP. Scale bar: 4 μm. Within Iba-1 means the signal of the target protein was merged by the signal of the Iba-1 constructed surface by Imaris v9.0.1. Merge means blue, red, and green signals overlaying. ## p < 0.01 and ### p < 0.001 vs. normal group. * p < 0.05, ** p < 0.01 and *** p < 0.001 vs. CRS group.

