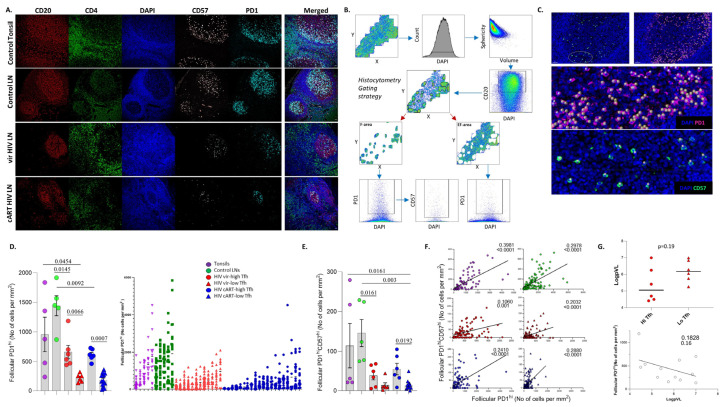
Figure 1.
Similar in situ cell density of TFH cells in viremic and cART PLWH LNs. (A) Representative examples of CD20 (red), CD4 (green), DAPI (blue), CD57 (gray) and PD1 (cyan) staining pattern from tonsil and control viremic and cART HIV LNs (scale bar: 30 μm). (B) The Histo-cytometry gating scheme used for the identification of TFH cell subsets based on their expression of PD1 and CD57 is shown. F and EF areas were manually identified based on the density of the CD20 signal, and the relevant cell counts were extracted for specific tissue localities. (C) Histo-cytometry-identified PD1hiCD57hi TFH cells were backgated to the original image using Imaris software. Each sphere represents one cell. (D) Bar graph (left) demonstrating the cell density (normalized per mm2 counts) of follicular PD1hi TFH cells in tonsils (N = 5), control LNs (N = 5), viremic HIV (N = 12) and cART HIV LNs (N = 20). Viremic and cART were further subdivided based on their TFH counts (HIV vir-high TFH (N = 6), HIV vir-low-TFH (N = 6), HIV cART-high-TFH (N = 6) and HIV cART-low-TFH (N = 14)). Each symbol represents one donor. The p values were calculated using the Mann–Whitney test and were corrected using FDR correction with q = 0.05 (Supplementary Table S2). Dot graph (right) shows the distribution of PD1hi cell densities among the samples. Each symbol represents a follicle. (E) Bar graph demonstrating the normalized per mm2 numbers of follicular PD1hiCD57hi TFH cells in the same groups/subgroups of the samples. (F) Linear regression analysis to address the correlation between PD1hi and PD1hiCD57hi absolute follicular counts between different subgroups. Each symbol represents a follicle. R-squared and p-values are displayed on graphs. (G) Linear regression analysis (lower) to address the correlation between normalized follicular PD1hi counts and blood viral load—pVL. Dot graph (upper) showing the pVL differences (as a log scale) between the viremic HIV subgroups.

