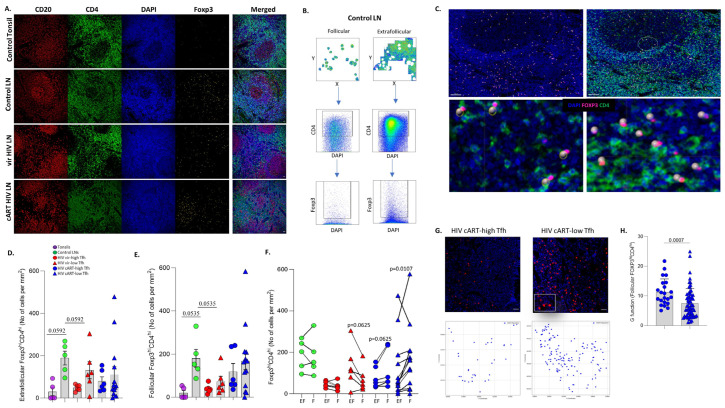
Figure 3.
Preferential accumulation of FOXP3hiCD4hi T cells in cART HIV follicular areas. (A) Representative examples of CD20 (red), CD4 (green), DAPI (blue) and FOXP3 (yellow) staining pattern from tonsil and control viremic and cART HIV LNs (scale bar: 30 μm). (B) Histo-cytometry immunophenotyping gating strategy used for the sequential identification of FOXP3hiCD4hi T cells in follicular and extrafollicular areas in a control LN (C) Representative backgating of Histo-cytometry-identified FOXP3hiCD4hi T cells, using Imaris software. Each sphere represents one cell. (D) Bar graph (left) demonstrating the normalised per mm2 counts of extrafollicular FOXP3hiCD4hi T cells in tonsils (N = 5), control LNs (N = 5), HIV vir-high-TFH (N = 6), HIV vir-low-TFH (N = 6), HIV cART-high-TFH (N = 6) and HIV cART-low-TFH (N = 14). (E) Bar graph showing the normalised per mm2 counts of follicular FOXP3hiCD4hi T cells in the same tissue samples. Each symbol represents one donor. (F) Bar graph with connecting lines demonstrating the normalized per mm2 counts of FOXP3hiCD4hi T cells in follicular and extrafollicular regions in each tissue analyzed. (G) Representative immunofluorescence images showing the distribution of FOXP3hi (green) and CD20hi (red) cells in follicles from one cART-high-TFH and one cART-low-TFH tissue. The corresponding digitalized (generated by the Python distance analysis script) images are shown too. (H) Bar graph showing the calculated G function values for follicular FOXP3hiCD4hi T cells in cART-high TFH (blue circles) and cART-low TFH (blue triangles) tissues (HIV cART-high TFH (N = 22) and HIV cART-low TFH (N = 64)). The p values were calculated using the Mann–Whitney test and were corrected using FDR correction with q = 0.05 (Supplementary Table S2).

