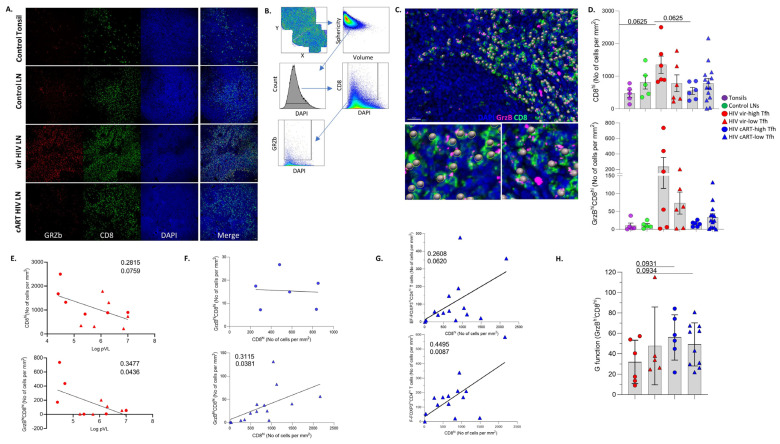
Figure 4.
Accumulated LN GrzBhiCD8hi T cells are negatively associated with PLWH blood viral load. (A) Representative examples of GRZb (red), CD8 (green) and DAPI (blue) staining pattern from tonsil and control vir HIV and cART HIV LNs (scale bar: 30 μm). (B) Histo-cytometry gating strategy used for the sequential identification of bulk CD8hi and GrzBhiCD8hi T cells. (C) Representative backgating of Histo-cytometry-identified GrzBhiCD8hi cells using Imaris software. Each sphere represents one cell. (D) Bar graph (upper) demonstrating the normalized per mm2 counts of bulk CD8hi cells in tonsils (N = 5), control LNs (N = 5), vir-HIV high-TFH (N = 6), vir-HIV low-TFH (N = 6), cART HIV high-TFH (N = 6) and cART HIV low-TFH (N = 14). Bar graph (lower) showing the normalized per mm2 counts of GrzBhiCD8hi T cells in the same tissue samples. Each symbol represents one donor. (E) Linear regression analysis showing the correlation between LN CD8hi (upper panel) and LN GrzBhiCD8hi (lower panel) normalized T cell counts with blood viral load. (F) Linear regression analysis showing the correlation between LN CD8hi and LN GrzBhiCD8hi T cell counts in cART HIV high-TFH (upper panel) and cART HIV low-TFH (lower panel). (G) Linear regression analysis to address the correlation between extrafollicular (upper panel) and follicular (lower panel) FOXP3hiCD4hi and LN CD8hi normalized T cell counts in cART HIV low-TFH subgroup. (H) Bar graph showing the G function values for LN GrzBhiCD8hi T cells in the HIV subgroups (vir-HIV high-TFH (N = 6), vir-HIV low-TFH (N = 5), cART HIV high-TFH (N = 6) and cART HIV low-TFH (N = 10)). The p values were calculated using the Mann–Whitney test and corrected using FDR correction with q = 0.05 (Supplementary Table S2).

