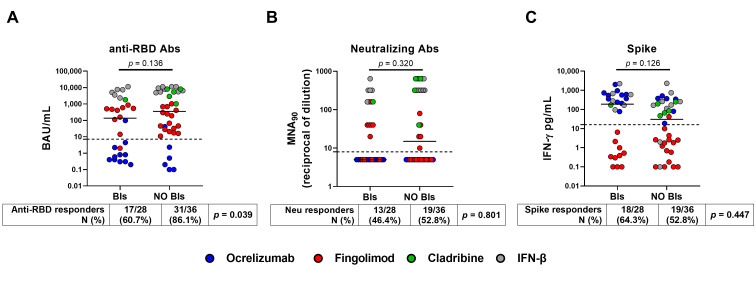
Figure 2.
Antibody and IFN-γ-specific T cell responses after the third dose of COVID-19 vaccine. The enrolled PwMS (n = 64) were stratified into two groups: BIs group (n = 28), which included those who had COVID-19 after the third dose, and no BIs group (n = 36), which included those who did not have COVID-19 during the follow-up period. (A) Anti-RBD-IgG were expressed as binding antibody units (BAU)/mL, (B) neutralizing antibodies as the reciprocal of the dilution (MNA90), while (C) IFN-γ levels were subtracted from the unstimulated-control value and reported in pg/mL. The cut-off of each test is indicated by the black dashed line (anti-RBD-IgG: 7.1 BAU/mL; MNA90: 10 reciprocal dilution and spike: 16 pg/mL). Each colour dot represents a different treatment as shown in the legend. A Mann–Whitney test was performed for pairwise comparison and Fisher Exact test was to compare the proportion of responders. A p-value < 0.05 was considered significant. Abbreviations: COVID-19, Coronavirus Disease 2019; PwMS, patients with multiple sclerosis; BIs, breakthrough infections; RBD, receptor-binding domain; IgG, immunoglobulin; Abs, antibodies; IFN, interferon; N, number.

