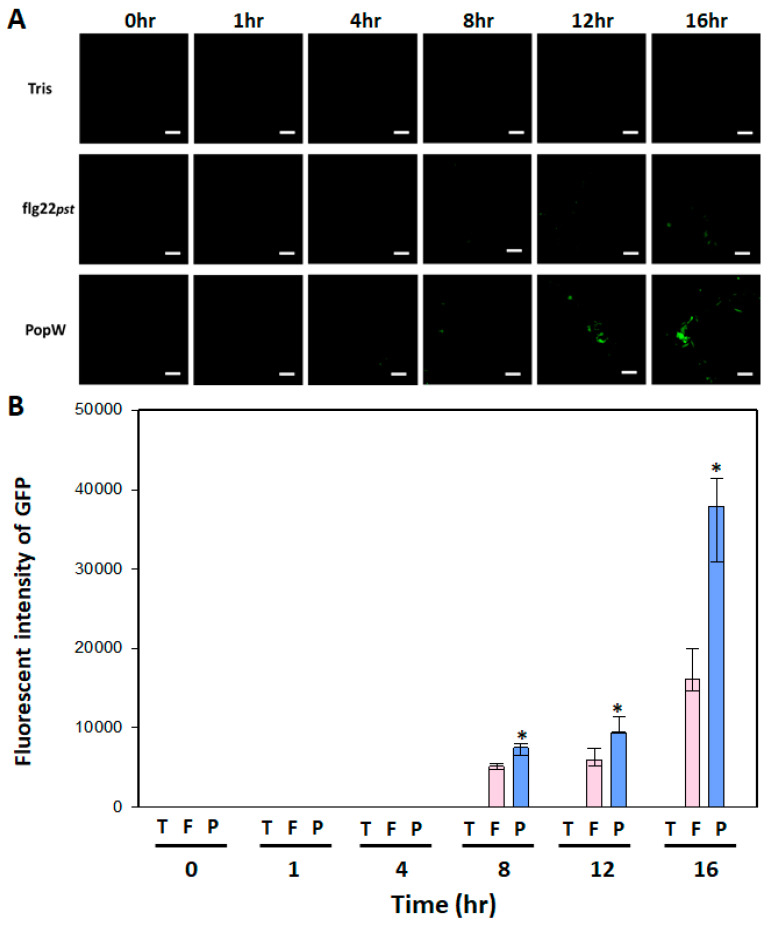
Figure 4.
The PAMP-induced fluorescence signal performance of the transgenic AtGSL5-GFP plant at different time points. The leaves of AtGSL5-GFP were infiltrated with flg22Pst or PopW and observed under fluorescent microscopy at distinct time points. (A) indicates the images of GFP fluorescence elicited by different treatments. The bar indicates 20 μm in length. (B) indicates the quantitative fluorescent intensity of GFP measured by Image J. The asterisks indicate significant differences between two PAMP treatments based on a t-test (p < 0.05).

