Figure 3.
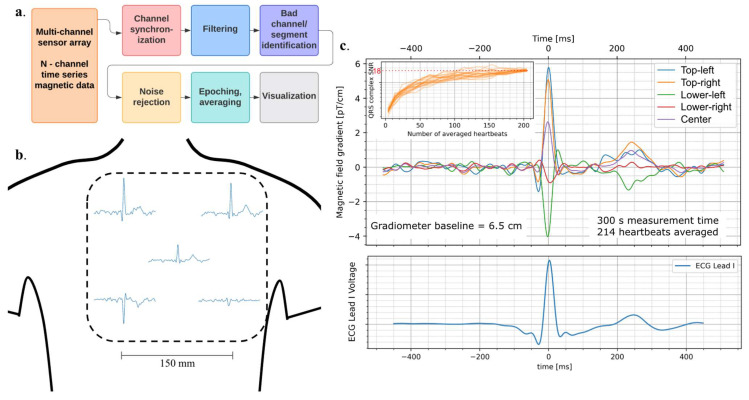
Signal processing pipeline and example data. (a). Signal processing pipeline flowchart showing processing steps for time-series data acquired from a multi-channel sensor array. After data are loaded from storage, channel synchronization is performed by aligning common signals that were injected in all channels, including the ECG, which is up-sampled to optimize trigger timing. Filtering follows, which consists of a 60 Hz IRR notch filter and 0.5–45 Hz bandpass using a bi-directional Butterworth digital filter. Then bad channels and segments are identified in and removed from the data using automatic power thresholding and basic data checks. The noise rejection step consists of a combination of gradiometry and Principal Component Analysis (PCA), where signal components that have high noise character are removed. MCG epochs are identified using ECG as a trigger, with automated epoch rejection based on signal power and timing criteria. Finally, epochs are averaged together, and the epoch-average is visualized. (b). Epoch-average for each gradiometer channel is displayed based on approximate relative positions over the participant’s chest. The upper right sensor and lower left sensor show inverted features. (c). (Upper) Epoch-average of all five gradiometric signals overlayed. Inset shows SNR scaling as a function of the number of epochs used to average. Each line corresponds to a different ordering of averaging. SNR > 10 can be achieved with 60 s of averaging and reaches 18 after 214 averages. (Lower) Corresponding ECG Lead I trace acquired simultaneously with the MCG data.

