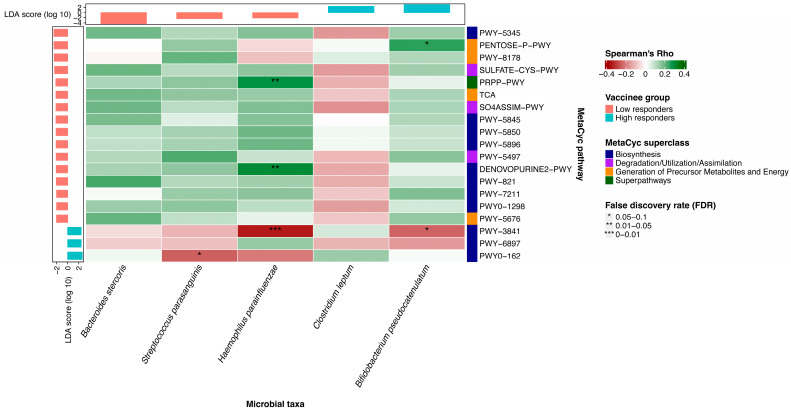
Figure 2.
Correlation between baseline bacterial species and metabolic pathways using Spearman correlation analysis. Heatmap depicting the association between the relative abundances of microbial species and metabolic pathways, as well as their enrichment in groups of low and high responders. The p-values have been adjusted for false discovery rate (FDR). An asterisk indicates an FDR in the range of 0.05–0.1; two asterisks represent an FDR in the range of 0.01–0.05; three asterisks indicate an FDR in the range of 0–0.01. An FDR below 0.1 is considered statistically significant.

