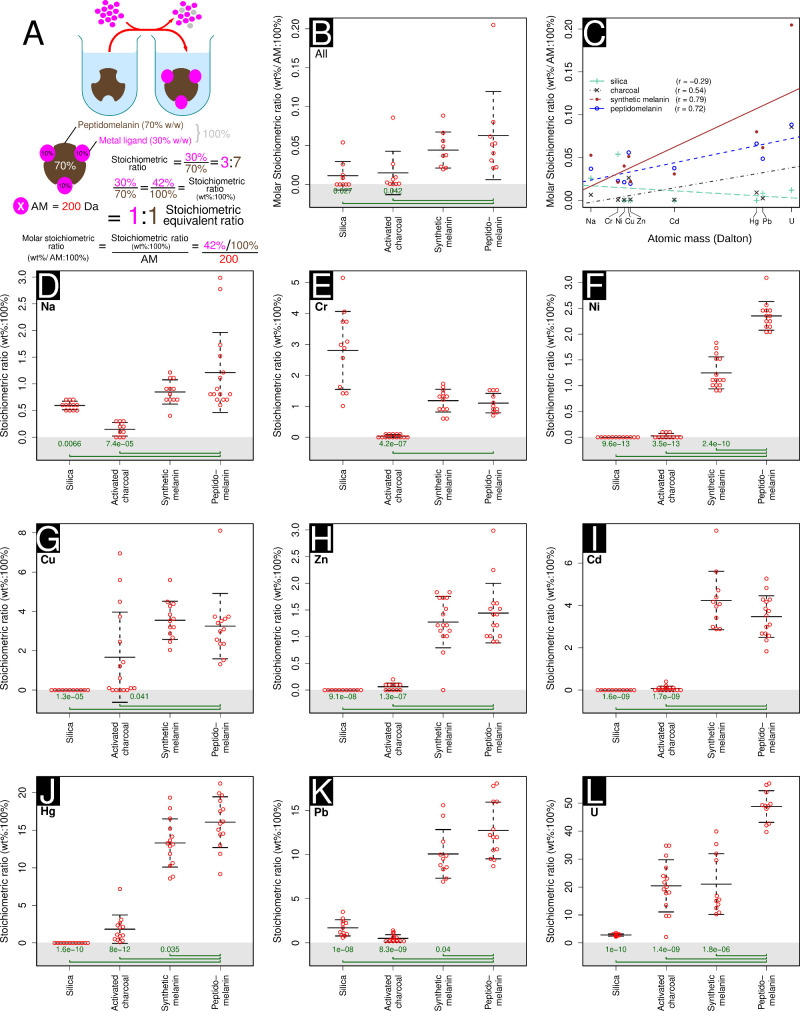
Figure 8.
Metal-binding stoichiometric assays used to determine which substance tested has the greatest capacity to chelate metal ions. Four substances were tested: silica, activated charcoal, synthetic L-DOPA melanin, and peptidomelanin. (A) A visual depiction of our protocol. An excess of metal salt is added to all substances tested. The unbound metal salt was then removed via dialysis or centrifuging and washing, depending on the solubility of the metal complex. SEM-EDS was used to estimate the percentage metal in all complexes. Placeholder data is used to describe how the stoichiometric ratio (wt%:100%), stoichiometric equivalent ratio, and molar stoichiometric ratio are calculated (AM: atomic mass). (B) The mean metal-binding stoichiometric ratio of all substances tested across 9 metals, ranging from sodium to uranium (as uranyl). Peptidomelanin can chelate significantly larger ratios of metal compared to silica and activated charcoal. Synthetic melanin does not display a significant difference in metal chelation compared to peptidomelanin. Here, the molar stoichiometric ratio is used to normalize our data across metals with different molecular weights. (C) The ratios of metal chelated by peptidomelanin, synthetic melanin, and activated charcoal is positively correlated with the atomic mass of the metal. Silica displays no strong correlation. Regression lines for all substances tested are shown. (D–L) Metal-binding stoichiometric assays used to determine which substance tested has the greatest capacity to chelate a given metal ion. The means obtained from these experiments were used as data for the summary statistics in panels B and C. The individual metal ions tested were: (D) sodium, from NaCl, (E) chromium, from CrCl3.6H2O, (F) nickel, from Ni(NO3)2, (G) copper, from CuSO4.5H2O, (H) zinc, from ZnSO4, (I) cadmium, from Cd(NO3)2, (J) mercury, from HgCl2, (K) lead, from Pb(NO3)2, and (L) Uranium, from UO2(CH3COO–).2H2O. For panels D to L, ≥10 SEM-EDS spectra were collected per sample (technical replicates). For panels B and D–L, statistical significance testing was performed using the Welch 2-sample t test. All substances were compared to peptidomelanin. P-values ≤0.05 are shown. Error bars represent the standard deviation from the mean. Raw data is provided in Data set S5.

