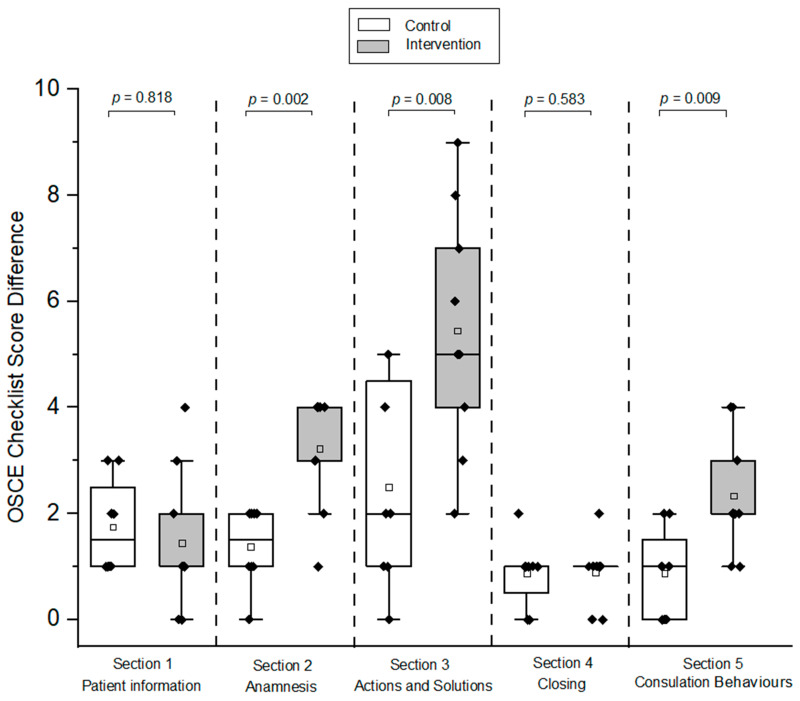
Figure 7.
Box plots of OSCE checklist score differences for each section between pre- and post-OSCE for intervention and control groups (HFS-adult). A one-sided Mann–Whitney test with a significance level of alpha = 0.05 was used to compare OSCE scores between the respective groups. The black diamonds (♦) indicate the score difference of each participant of post- and pre-OSCE. OSCE = Objective Structured Clinical Examination. HFS = high-fidelity simulator. The hollow blocks (□) represent the means of score differences in each OSCE checklist section for the respective groups.

