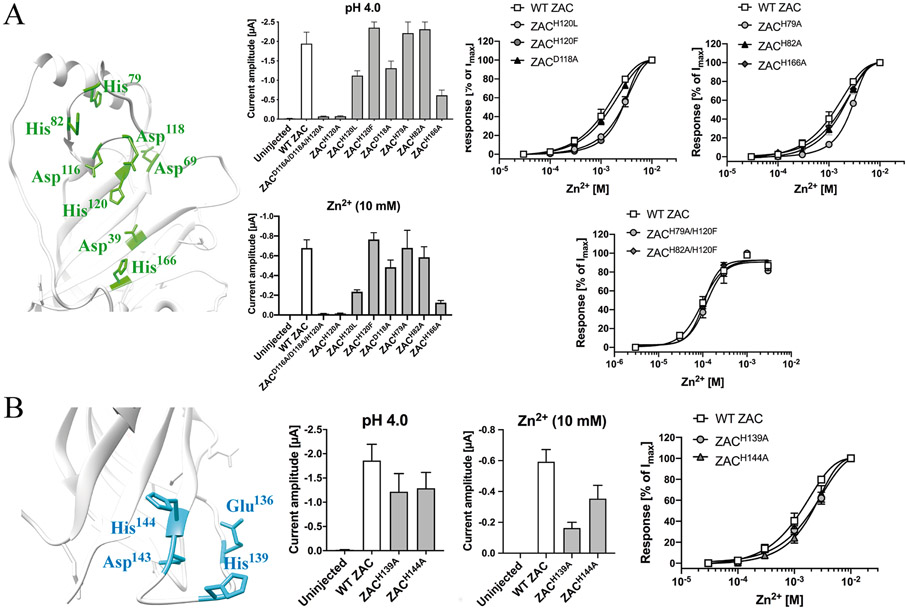
Fig. 6. Probing the importance of candidate Zn2+-binding residues in Clusters 1 and 2 of the ZAC ECD for Zn2+-mediated ZAC activation.
A. Cluster 1. Left: Cluster 1 residues (in green, detail of ZAC homology model). Middle: Averaged IpH 4.0 and I10 mM Zn2+ values recorded from oocytes expressing WT ZAC and various ZAC mutants [means ± S.E.M., H+: n = 5–8 (mutants), n = 14 (WT); Zn2+: n = 6–8 (mutants), n = 16 (WT)]. Right: Averaged concentration-response relationships displayed by Zn2+ at oocytes expressing WT ZAC and various ZAC mutants [Top graphs: means ± S.E.M., n = 6–8 (mutants), n = 14 (WT). Bottom graph: means ± S.E.M., n = 6–8]. B. Cluster 2. Left: Cluster 2 residues (in cyan, detail of ZAC homology model). Middle: Averaged IpH 4.0 and I10 mM Zn2+ values recorded from oocytes expressing WT ZAC and various ZAC mutants [means ± S.E.M., H+: n = 6–8; Zn2+: n = 6–7]. Right: Averaged concentration-response relationships displayed by Zn2+ at oocytes expressing WT ZAC, ZACH139A and ZACH144A [means ± S.E.M., n = 7–8 (mutants), n = 14 (WT)].

