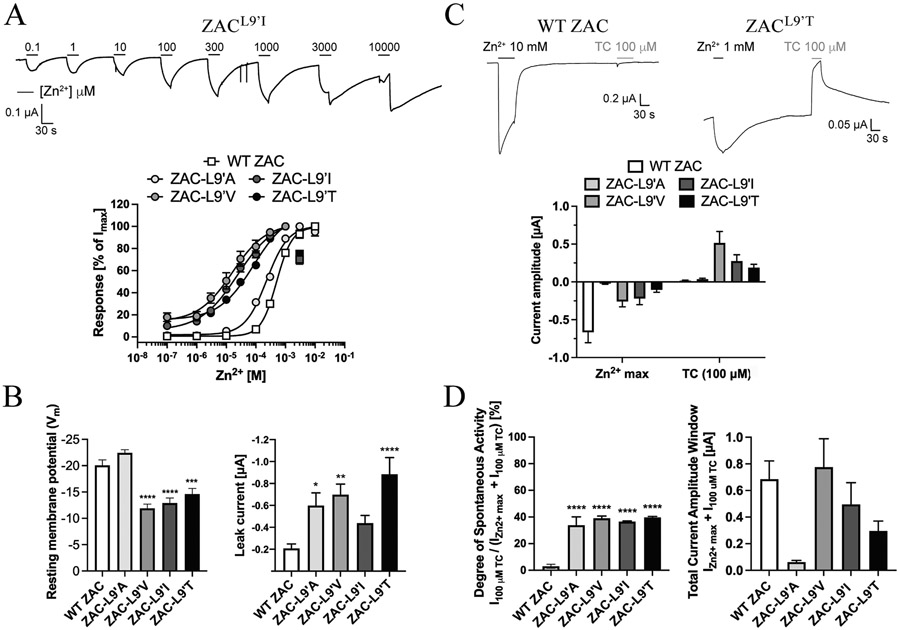
Fig. 8. Functional importance of the Leu9′ residue in ZAC.
A. Representative traces for Zn2+-evoked currents in ZACL9′I-expressing oocytes (top), and averaged concentration-response relationships exhibited by Zn2+ at WT ZAC, ZACL9′A, ZACL9′V, ZACL9′I and ZACL9′T (means ± S.E.M., n = 6–8) (bottom). B. Resting membrane potentials (left) and leak currents (right) recorded from oocytes expressing WT ZAC, ZACL9′A, ZACL9′T, ZACL9′V and ZACL9′I. Data are given as mean ± S.E.M. values (n = 40–60). C. Representative traces for Zn2+- and TC (100 μM)-evoked currents in WT ZAC- and ZACL9′I-expressing oocytes (top), and averaged current amplitudes evoked by a saturating concentration of Zn2+ and by TC (100 μM) in WT ZAC-, ZACL9′A-, ZACL9′V-, ZACL9′I-, and ZACL9′T-oocytes (means ± S.E.M., n = 6–8) (bottom). 10 mM Zn2+ were used for WT ZAC and 1 mM Zn2+ were used for ZACL9′A, ZACL9′V, ZACL9′I and ZACL9′T. D. Degrees of spontaneous activity [defined as: I100 uM TC/ (IZn2+ max + I100 uM TC)] (left) and total current amplitude windows (defined as: IZn2+ max + I100 uM TC) (right) exhibited by WT ZAC, ZACL9′A, ZACL9′V, ZACL9′I and ZACL9′T expressed in oocytes.

