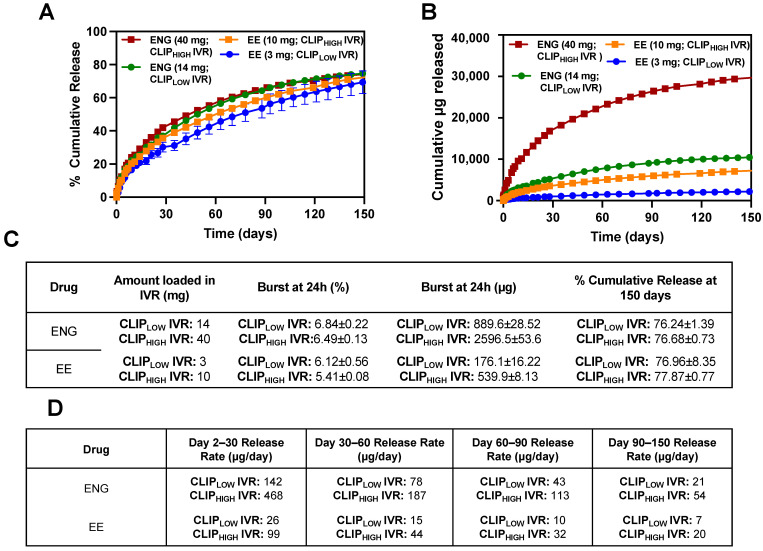
Figure 4.
In vitro release of ENG/EE from CLIPHIGH IVR compared to CLIPLOW IVR. (A) Cumulative (%) in vitro release of ENG/EE from CLIPHIGH IVR compared to CLIPLOW IVR. (B) Cumulative (µg) in vitro release of ENG/EE from CLIPHIGH IVR compared to CLIPLOW IVR. (C) Summary table of in vitro release profiles. (D) Summary table of in vitro release rates. All studies were carried out in triplicate in SVF pH 7 (sheep vaginal pH) release media. Each release curve represents the average ± standard deviation. Maximum standard deviation for in vitro cumulative release is less than 2%.

