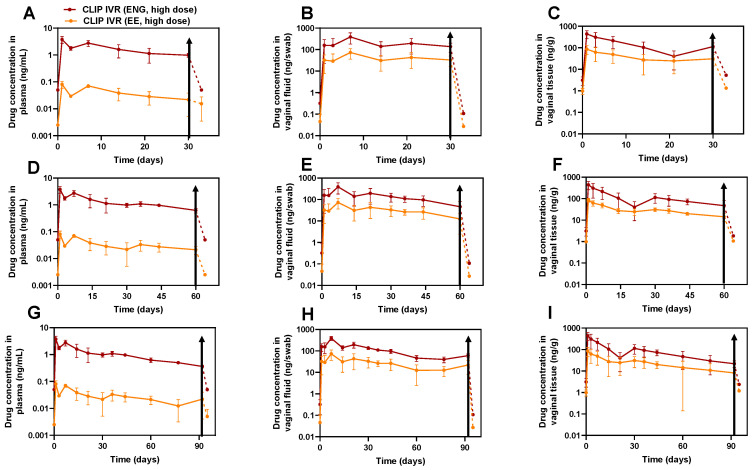
Figure 6.
Assessment of PK and PK tail after CLIPHIGH IVR removal. (A–C) CLIPHIGH IVR removal at 30 days post-IVR administration in (A) plasma, (B) vaginal fluid and (C) vaginal tissue. (D–F) CLIPHIGH IVR removal at 60 days post-IVR administration in (D) plasma, (E) vaginal fluid and (F) vaginal tissue. (G–I) CLIPHIGH IVR removal at 92 days post-IVR administration in (G) plasma, (H) vaginal tissue and (I) vaginal fluid. Drug concentration curves are plotted as average ± standard deviation. Data from all sheep (n = 6) were pooled together for timepoints when IVRs were inserted. At day 30 post-IVR administration, n = 2 IVRs were removed from sheep (A–C) and at days 60 and 92 post-IVR administration, n = 3 IVRs were removed (D–I). Solid lines indicate when IVRs were inserted, and dashed lines indicate post-IVR removal. Black arrows indicate the time at which IVR was removed. LLOQs of ENG in plasma, vaginal tissue and vaginal fluid were 0.1 ng/mL, 5.11 ng/g and 0.215 ng/swab, respectively. LLOQs of EE in plasma, vaginal tissue and vaginal fluid were 0.005 ng/mL, 2.55 ng/g and 0.054 ng/swab, respectively. Samples that were below the limit of quantification were represented as LLOQ/2. Individual replicates are shown in Figure S3.

