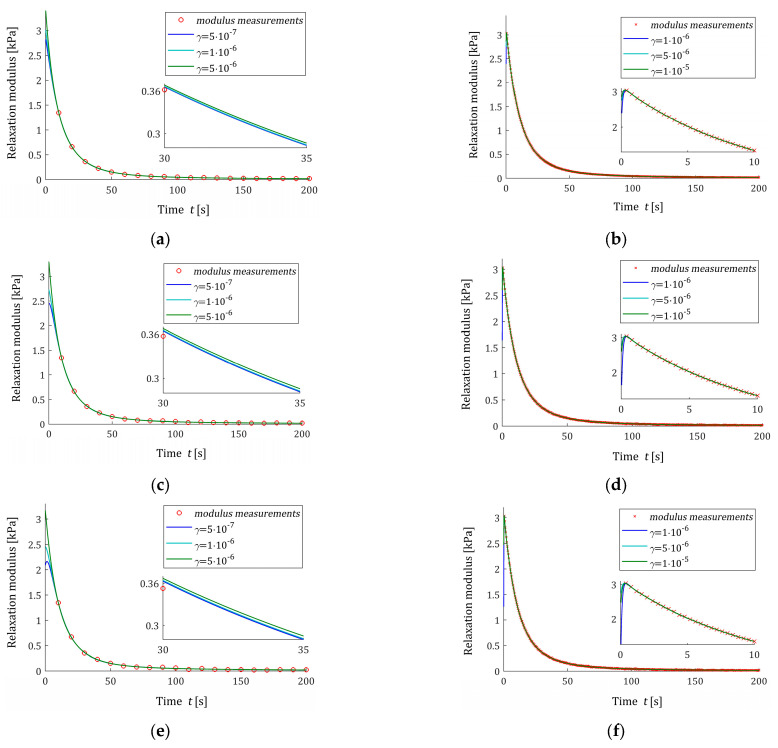
Figure 6.
The measurements of the ‘real’ relaxation modulus (49) (red circles) from Example I and the model (27) for measurements of the relaxation modulus corrupted by normally distributed additive independent noises with zero mean value and standard deviation : (a) and ; (b) and ; (c) and ; (d) and ; (e) and ; and (f) and .

