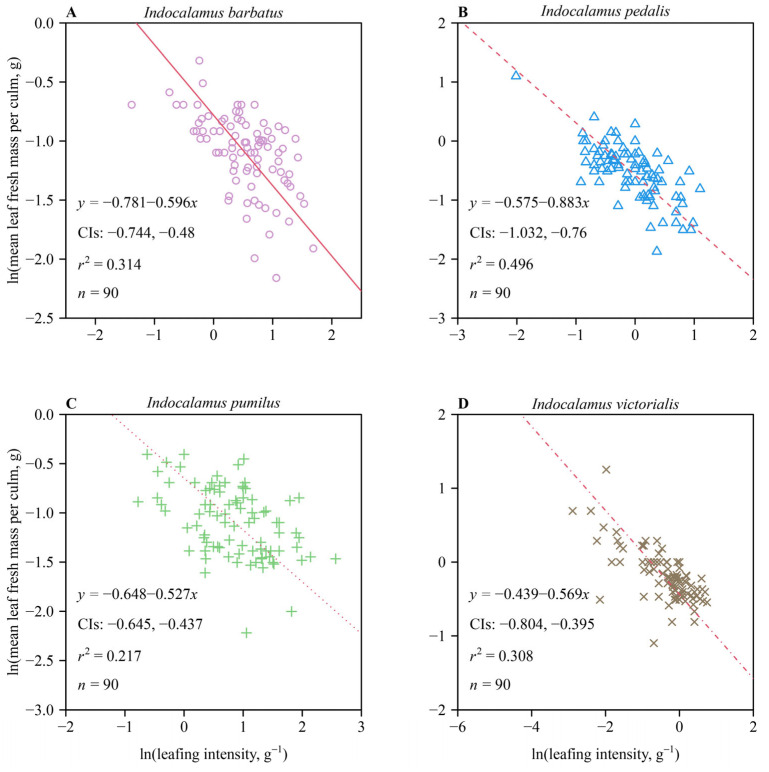
Figure 2.
Fitted results for bivariate plots of mean leaf fresh mass per culm vs. leafing intensity on a log–log scale for four species of Indocalamus: I. barbatus (A), I. pedalis (B), I. pumilus (C), and I. victorialis (D). The red lines are the regression curves; CIs represent the 95% confidence intervals of the slope; r2 is the coefficient of determination; and n is the number of culms sampled for each of the four species.

