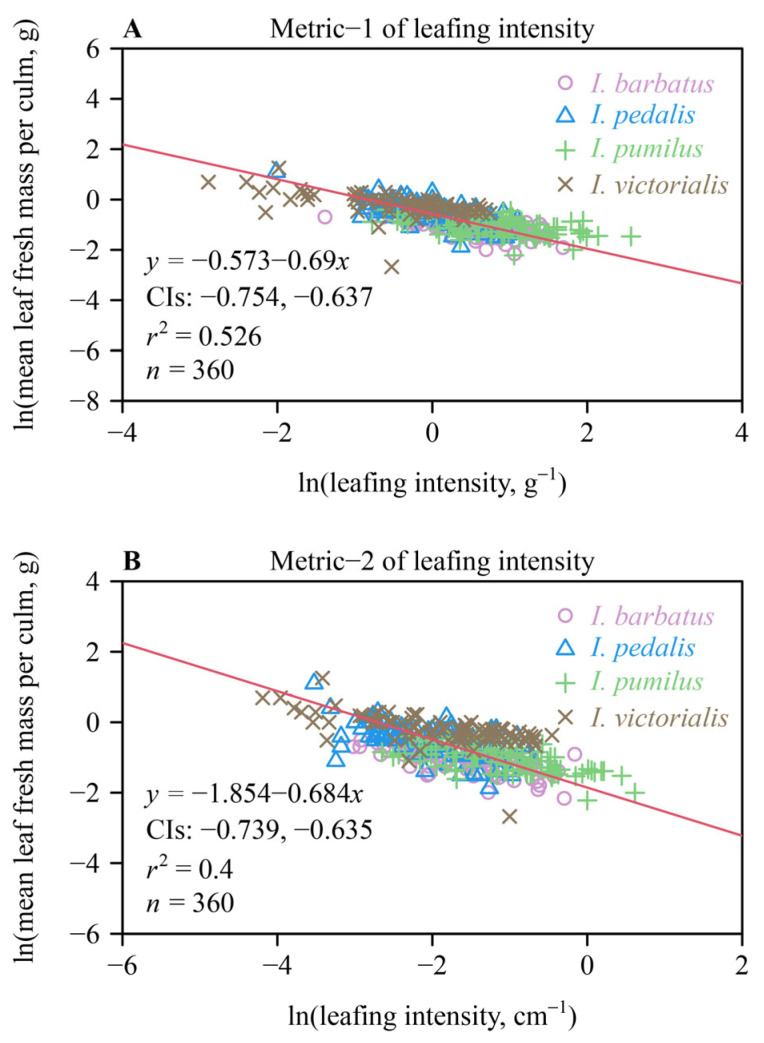
Figure 3.
Fitted bivariate log–log scaling relationships for the pooled data of the four species of Indocalamus. (A) Mean leaf fresh mass per culm vs. leafing density from definition 1, and (B) the mean leaf fresh mass per culm vs. leafing density from definition 2. The red lines are the regression curves; CIs represent the 95% confidence intervals of the slope; r2 is the coefficient of determination; and n is the number of culms sampled for each species.

